![]()
At the end of each year, we like to look back and discuss some of the significant changes that happened to our service and this year has seen some of the biggest changes since we started. So without further adieu let's go through the major milestones.
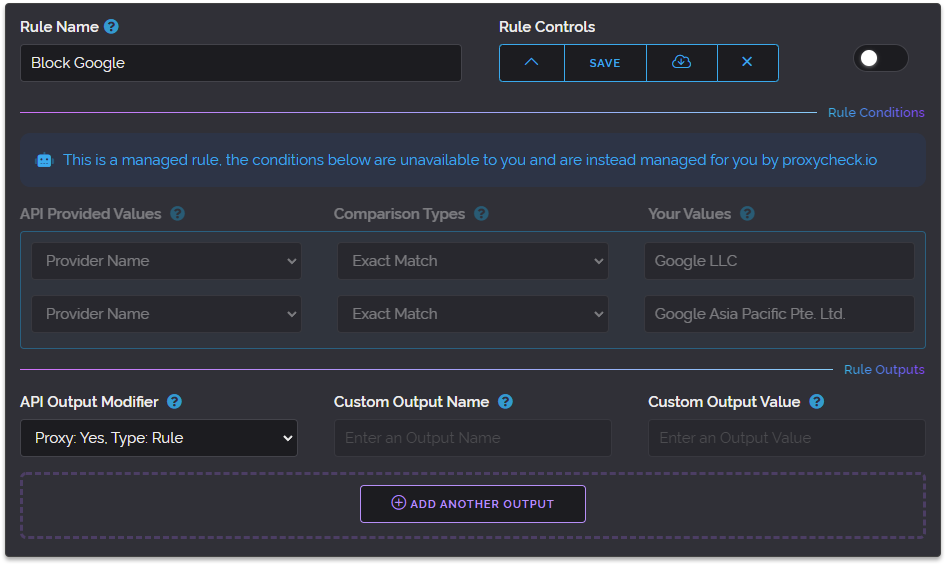
Back on January 2nd we launched managed rules which are like our previously available feature called custom rules but differ in that we (proxycheck.io) manage the conditions of the rule for you.
This feature enabled you to add rules that have changing data (for instance rules that target a specific organisation) and have us update the rule over time for you.
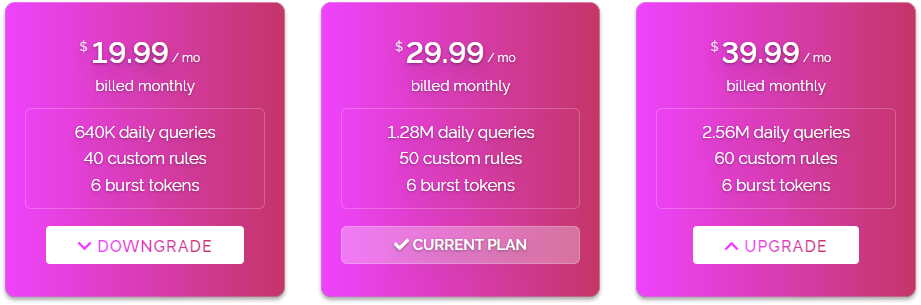
Next on January 19th we introduced easy plan alterations. This was a major change in the flexibility of our service enabling you to upgrade or downgrade your plan at any time and receive credits or deductions when changing plans, always to save you money.
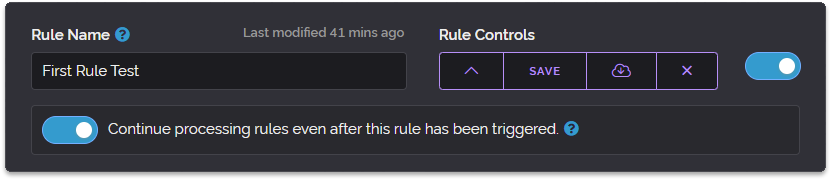
On January 21st we added a major improvement to custom rules called continued execution which allowed your rules to work more like filters allowing multiple rules to work on a single query instead of stopping after a single rule was triggered.
All of the above concluded a very busy January but February was to bring the biggest change to our infrastructure since we first started. Namely our European Cluster Refresh on February 10th.
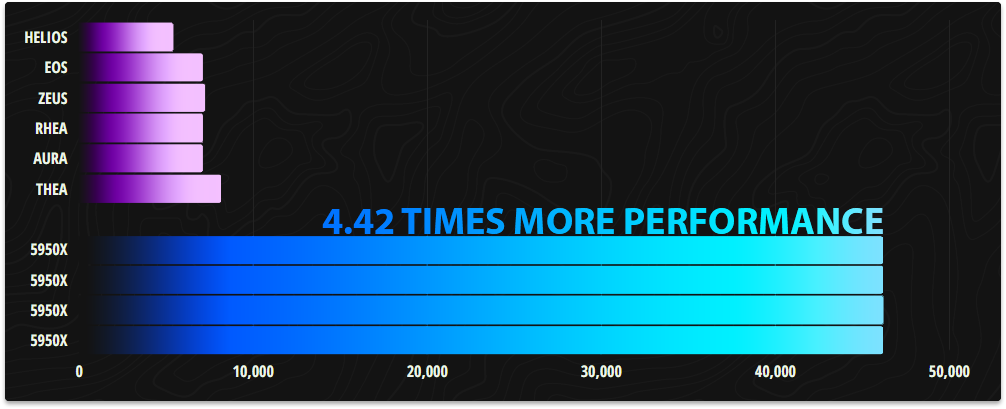
This was as the graph above illustrates a ginormous performance increase for our infrastructure delivering a 4.42x performance improvement when comparing our four new servers to our six previous ones. This performance increase was so great that we haven't needed to add more servers since February 2022 when our new infrastructure was deployed.

That upgrade not only delivered astounding CPU performance but also quadrupled our system memory and doubled our storage quantity. And speaking of storage we eliminated the last hard disk drives from our infrastructure with this upgrade, switching them for the fastest enterprise grade U.2 NVMe drives on the market and in doing so dramatically reduced our storage latency and increased our storage throughput.
Our next major feature was disposable email detection which launched 5 days later on February 15th. This was a major departure from our core service of detecting anonymous IP addresses but we felt it was close enough in line with what our service stood for to offer it.
And put simply, disposable emails were a nuisance that even we were dealing with daily and so we saw a great synergy between what we already offered and what detecting disposable addresses would accomplish. It has been a great feature for us that has opened our service up to new users.
On April 20th we introduced the ability for customers to pay invoices themselves manually. This was mostly brought about due to new Indian banking regulations that disallowed automatic subscription payments to international entities. We spruced up our invoicing UI during this update as well.
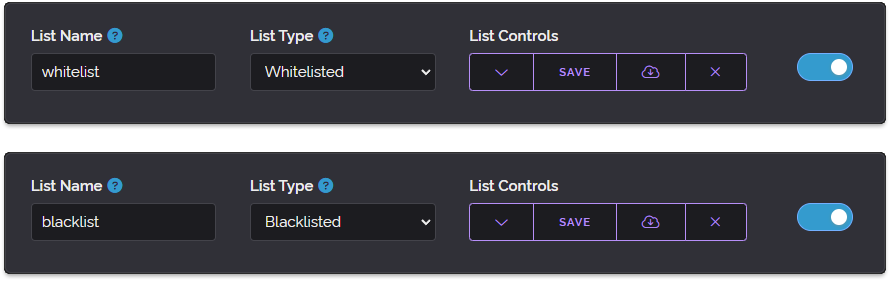
On May 25th we released a major update to our whitelist/blacklist feature that had been present since the Dashboard was first added and had seen very little love since that time. In fact, the original whitelist/blacklist feature was so early in our deployment that it was sticking out like a sore thumb and because of that we wanted to redo it.
One of the things we thought about during the redesign process was how can we make this feature even more useful while maintaining its class-leading ease of use. One of the things we did with the original listing feature is we gave you a large canvas in which you could put anything you wanted, essentially a big text document where you could write anything without needing to fiddle with UI controls or place things into pre-defined categories.
Our competitors often operate a whitelist/blacklist feature as a series of input fields where you enter one address per field requiring you to keep clicking to add new entries often with a small limit to how many entries you can have in total.
We never did it that way because we felt that was a very poor user experience. It requires far too much input from the user when what they want to do is just copy and paste a large list of addresses in one go.
So when it came time to refresh the interface we knew we wanted to maintain that ease of use however simply having a large text field as we had previously didn't look attractive. So what we did was containerise the lists into what we now call "Custom Lists".
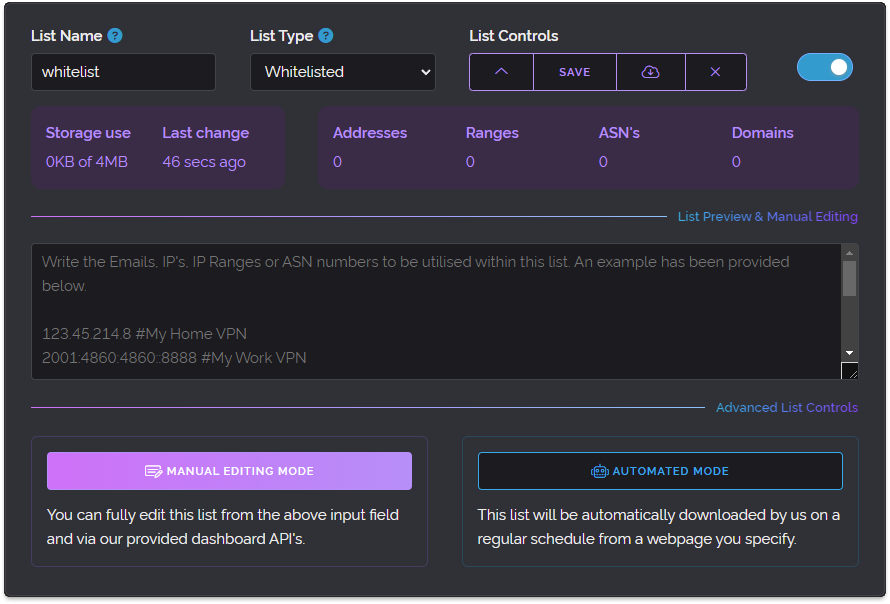
Above is an expanded view of one such list with all the various controls. This new view enabled easier exporting, re-arranging, a nicer visual appearance, list naming and even creating lists that wouldn't be used for Whitelisting or Blacklisting at all but instead would only be utilised by Custom Rules, an earlier feature we introduced previously.
One other major thing it introduced was downloadable lists. We had customers tell us they liked using the Blacklist feature for example but they found it labour-intensive to keep it updated. Although we did add an API to manipulate White/Blacklists many years ago that does require coding experience.
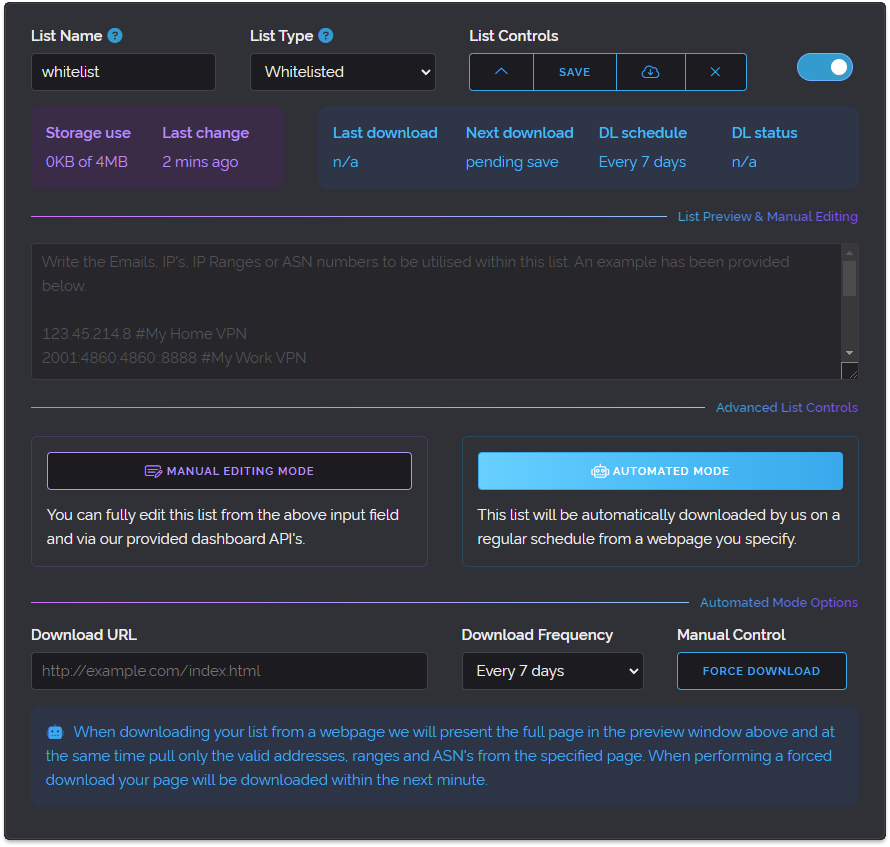
And so as the above image illustrates we added a new Automated Mode button which when pressed allows the user to specify a website URL and our service will grab the content of the provided page and use it in their Custom List on a specified schedule. This has been a very well-received feature which is used extensively by our users since its introduction.
On June 9th we reached a Blog milestone with our 200th blog post. We made a post all about dark patterns in design (deceitful user-interfaces) and how we shy away from those practices. It made for an interesting topic.
On August 12th we launched a new site-wide changelog page allowing for easier tracking of new features, improvements and fixes across our entire website.
On September 2nd we added Time Zones to the API result a much-requested feature that lets you see an IP's local timezone.
On September 12th we finally added support for paying for service with a myriad of cryptocurrencies. A much-requested feature since the beginning of our service, this has been a net good for the service, we've processed many payments using Bitcoin, Litecoin, Ethereum, Tether, USD Coin and Dogecoin since its introduction.
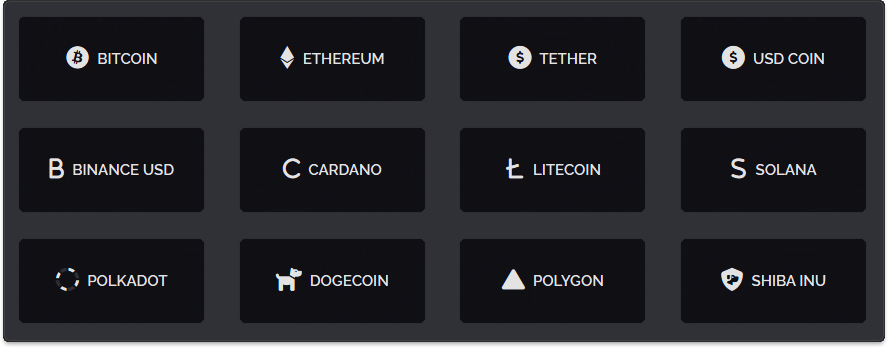
Above are just a few of the crypto coins we now accept for service.
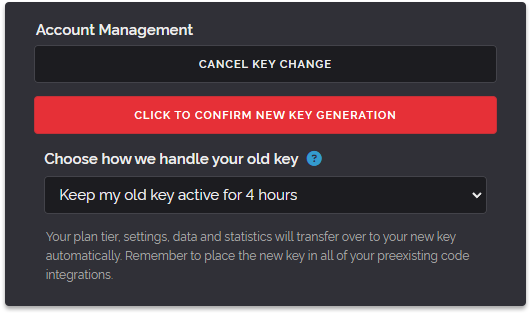
Then as if the month wasn't busy enough we launched a better way to handle your API key changing on September 17th. This was a requested feature for enterprises that like to rotate their API keys regularly but didn't want to have a second of downtime while they did it.
On October 17th we introduced Postcodes to the API. And much like the timezone feature mentioned above, this was a user-requested feature that we spent a lot of time bringing to the API, it was important for us that it was very accurate before we launched.
And that brings us to today. There are many things we launched this year that were not user-facing. For example, the backend system that we use to shuffle data between servers was completely rewritten. We managed to significantly reduce CPU usage dedicated to database synchronisation through this effort.
We also overhauled how we scan for new proxies and traverse VPN companies' infrastructure. Both for speed and reliability reasons. We also worked heavily with our partners to improve our methods of extracting data from their infrastructure whether they provide it to us directly through our import system or whether we go to them and download the data from their servers.
Another thing we focused heavily on this year was false positives. As mobile internet access and CG-NAT becomes ever more prevalent we have to do more in discovering shared addresses and scrubbing them from our database, we made huge strides in this area and as a result reduced our false positive fate significantly.
As another year comes to a close we got a lot of things done. The physical infrastructure upgrade, custom lists and the accepting Cryptocoin are personal highlights.
We hope everyone had a wonderful festive holiday and we look forward to bringing you even more great stuff in 2023!