Today we would like to share with you some updates we have regarding our machine learning infrastructure geared towards post-processing. This is where you send us an IP Address to be checked and after we give you an immediate answer we put it into a large pool of addresses to be examined where time is no longer an issue.
In February 2019 we made a blog post about a new server we introduced called STYX which was designed to do all post-processing inference to free up resources on our core cluster so they could spend more time answering queries instead of processing data.
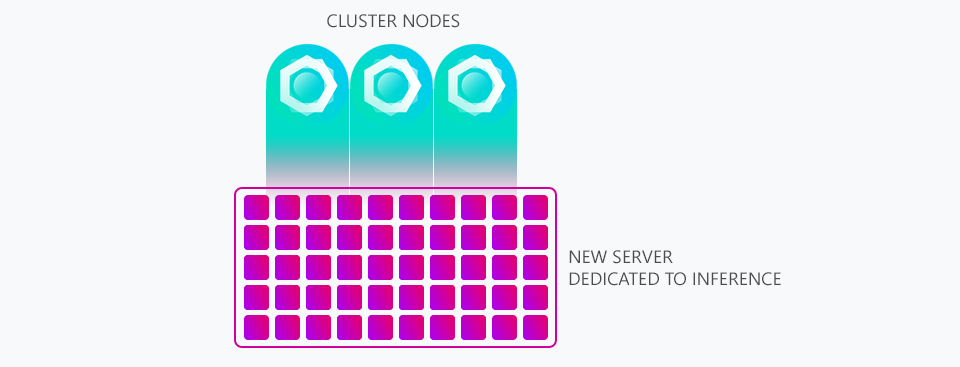
You can see above a graphic we shared within that post illustrating how our (at the time) three cluster nodes would feed data into STYX to be processed by its many processing cores.
Since then the volume of addresses we process every day has increased to an unimaginable amount. To keep up with this growth we've increased our cluster size from 3 to 5 servers, replaced our weakest servers with stronger ones and gone to extreme levels of code optimisation all of which has allowed for our level of growth without spending obscene amounts of money on cloud providers.
But coming back to STYX we did hit a problem there. No amount of code optimisation can get around the fact that there are simply too many addresses to process on one system. We put in some stop-gap measures by creating a ratio system where only half of addresses were tested, then 1/3rd, 1/4th and finally only 1/5th. Eventually if we continued in this manner only a tenth of all addresses would be able to be processed by the post-processing engine on STYX.
And so that brings us to todays post where we have invested in an entirely new range of infrastructure dedicated to inference. They consist of various servers with various core counts. Some of the largest servers we've acquired for this now feature dual 18-Core XEON's. In-fact our inference infrastructure is now several times more powerful than our cluster that answers customer queries.
STYX is still with us but it has been repurposed as a job scheduler. It will now monitor all of the inference infrastructure, hand out jobs as needed and retrieve the results. We created a little fun visualiser for ourselves to see what STYX sees as it hands out work which we thought would be interesting to show below.
So what is the net benefit of all this work? well the main thing is we can once again fully examine every single address we receive from customers within our post-processing inference engine and we can easily add more servers to the inference infrastructure as needed in the future which is something we will need to do as the service becomes ever more popular.
One of the quickest ways to see the results of our new infrastructure is to check out the threats page. This is where we post only addresses our post-processing inference engine found to be proxies and it takes a random assortment of the most recent few hundred to be displayed there. It wasn't so long ago that all the entries on that page would show as last being seen 8 to 12 hours ago but with the new engine steaming through data we're discovering more proxies per hour than we used to discover per day.
This is why you'll see a lot of addresses on there were last seen just an hour ago or less. Being able to obtain knowledge of proxies like this that are "undiscovered" on the wider web (ones we've discovered that aren't yet posted publicly on message boards, blogs and websites) is important to us as it's these proxies that are perhaps the most dangerous and most likely are being abused by the individual[s] who set them up in the first place (often on hacked remote servers and IoT devices).
In addition to broadening our infrastructure we did also rewrite the way we synchronise information within our cluster. We found with so much data being updated per second there were some bottlenecks which we were able to completely solve several days ago.
Some of this was caused by the immense data changes occurring due to the new infrastructures ability to process so much data at once and some of it was a watershed moment caused by some internet problems affecting one of our cluster nodes that meant it had more data to synchronise than usual once it came back online, during this process we noticed how it wasn't able to reach parity with the other nodes after several hours due to just how much data was changing during the synchronising process.
So that's what we wanted to share with you today, bigger and better infrastructure that leads to tangible improvements in proxy detection.
Thanks for reading and have a great week!
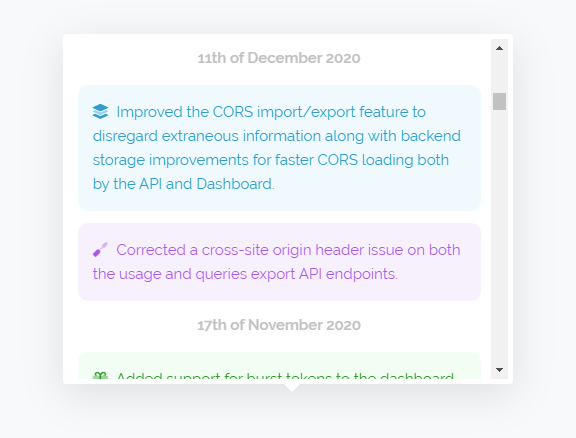 Above is the new changelog v2 interface which is now live across all our pages and as you can see it's colour coded. We now list new features in green, changes to existing features in blue and fixes in purple. We've also added some icons to the side which are more for fun than functionality. The new interface uses our updated interface guidelines that we've been adjusting the site to meet over the past several months.