Introducing Custom Rules

Today is a day I've been looking forward to for a very long time because today I get to share with you all our new custom rule system. This is a new dashboard feature that puts you in complete control of how the API responds to your queries with an unparalleled level of customisation.

This feature has been on our long term roadmap for as long as I can remember. It required lots of planning, experimenting and testing, we wrote the feature several different times from scratch until we nailed it.

We know it's going to be a big deal for our customers because you've been telling us so every month for the past two years. You may not have specifically said the words "I want custom rules!" but you definitely said "Can the API respond this way if x and y happens?". Every month we're asked to add more flags to the API that allow specific use cases.

The two most common requests we receive are. Can you add an easy way to do Country blocking on the API side and what if I only want to block the really bad VPN's and not okay ones? - Well with the new custom rules feature you can accomplish both of these things and a whole lot more.

And that's because not only can you alter the logic of the API but you can overwrite responses with your own ones or create entirely new custom fields containing the strings you specify.

So that's enough talking, let's show it to you. Below is an animation showing the global controls for your rules. The extra control buttons you need only appear when you have rules created and they disappear when you don't. We feel this makes the interface more approachable, less intimidating.

Image description

When clicking on the add a rule button a new rule will be added to the page. Below we've added a rule and expanded it to reveal all the configurable options. We've also populated it with three conditions and a single output modifier. Each rule you create can have as many conditions and output modifiers as you like. And we also allow you to specify multiple values for a single condition, more on that in a bit.

Image description

In the screenshot above hopefully you can identify what this rule will accomplish just by looking at it. But essentially if you send an IP to be tested and it's a VPN but its risk score is below 67 then with this rule enabled the API will output Proxy: No. Normally in this situation it would output Proxy: Yes.

Which means this rule has enabled you to only block VPN's which we consider dangerous by utilising our risk score. Now you could create logic like this in your own client software that talks to our API. But most of our customers are not computer programmers and are instead utilising plugins and client software which may not take advantage of all our API responses or the developer of their software may have locked-in how the software reacts to most API responses and that may not suit your particular use case.

By moving this logic to the API side with custom rules it enables you to use even the most basic clients available that support our API and still make full use of all current and future features.

The UI we've designed for custom rules goes beyond just looking nice. It's highly functional with instant feedback letting you know if a condition or output modifier you've entered won't work. It can automatically disable rules if the rule isn't valid and let you know which part of a rule needs to be changed before it can be enabled.

We've also made it so you can drag and drop rules around enabling you to adjust the order in which rules are acted upon without the need to erase a rule just because it's in the wrong position.

Image description

Now you're probably thinking, great now the Whitelist and Blacklist features are going away. Well don't worry, that's not happening. We love those features and it makes it really easy for customers to do simple actions based on IP Addresses, IP Ranges and AS numbers. And in-fact the new rule system works fully in conjunction with those features, you can even make rules based on the result of those lists.

So this all sounds great right - but what does it cost! - I hear you saying. Well we're not charging extra for rules. Instead we're giving you a quantity of rules based on your current plan sizes. Customers on our free plan can enable three rules while our starter paid plan of $1.99 can enable six rules. Each plan can enable an additional three rules over the previous plan.

And to be clear, we're saying enable because all accounts regardless of plan size can create an unlimited amount of rules. You just can't enable more than your plan size allows. So you can create a lot of different rules for testing and see what works for you by toggling different rules on and off without needing to delete one rule to create another.

Each rule you create can have an unlimited amount of conditions and output modifiers and as I mentioned previously you can provide multiple values for each condition within a single rule, this is done by separating them by a comma. This means if you wanted to create a rule that applied to 20 different countries you could do that by simply listing 20 countries as a single value in a single condition. You do not need to create 20 different conditions or 20 different rules to accomplish that.

So that is the new custom rules feature. It's live right now for all customers within the dashboard and we would love to hear your feedback. The last thing to mention is this feature only works on our v2 API so if you've not made the switch from the v1 API now is the perfect time to do so!

Thanks for reading and have a great week.


Detailing todays service outage

Today proxycheck.io suffered what we believe to be our first total service outage and it was caused by Cloudflare, our Content Delivery Network (CDN) partner.

The outage did not only affect us but every single website that uses Cloudflare. This means around 1/3rd of all websites worldwide were affected too. That is an unfathomable amount but it is how many websites trust and use Cloudflare.

This outage lasted 27 minutes and we're incredibly sorry that this happened, unfortunately due to Cloudflare's own website and web based API being affected by the outage we were unable to move our services to a different content delivery network or to expose one of our own servers to the internet directly as a stop-gap measure until their infrastructure started to work correctly again.

This is a highly unusual and unexpected point of failure in our infrastructure design and although we had considered this could happen we deemed the risk so small that we did not put in place a mitigation strategy as Cloudflare is such a professional, large and trusted company which as noted above has 1/3rd of all the worlds websites using them we did not think an outage of this magnitude was likely to ever happen.

Clearly we were wrong about that and we must diversify our entire infrastructure to be resilient against these kinds of failures. We did already build redundancy into every pillar of our own core infrastructure but didn't do so for our CDN which is the last mile so to speak between our servers and our customers, it's also the only piece of our infrastructure that we pay another company to handle solely on our behalf.

We hope that all of our customers can accept our sincere apologies for this outage and that we take full responsibility for it occurring, no one forced us to use Cloudflare, we chose to do so believing they were the best way to bring our product to you and we still do believe that but clearly having no redundancy at the CDN level was a big mistake which we will rectify.

When Cloudflare releases an official statement about this outage we will link it within this blog post.

EDIT [ Cloudflare has now released a blog post here. ]

Thanks.


Official PHP Library Updated

Over the past month we've released two significant updates to our PHP Library which bring full feature parity with our v2 API and also with our dashboard API's.

This means you can now use all the flags that the v2 API offers including our latest risk score and attack history data as well as view your account statistics, page through your positive detection log and more all with the library.

Here is a full rundown of the changes across our v0.1.3 (May) and v0.1.4 (June) releases.

  • Added support for viewing account statistics and positive detections
  • Added support for risk scores and attack history
  • Added local whitelisting in addition to blacklisting
  • Added isocode support to the country white/blacklist features
  • Improved error handling when option flags are absent

You can get the latest release (v0.1.4) from packagist.org here or from our github page here. We hope you'll all enjoy the library, we are accepting feature requests for it. Local country whitelisting support was one such customer request.

Thanks and have a great week.


Attack history now available through the v2 API

Today we've released an update to the v2 API which brings our vast attack history to the API so that you can finely tune your custom security model using our attack data.

We thought about introducing this with a new flag but we felt it fit best with our risk flag. So instead of supplying &risk=1 and only receiving a risk score you can now supply &risk=2 and receive both a risk score and detailed attack information. Below is an example of how this data looks in the API.

{
    "status": "ok",
    "node": "RHEA",
    "51.38.22.253": {
        "asn": "AS16276",
        "provider": "OVH SAS",
        "country": "France",
        "latitude": 48.8582,
        "longitude": 2.3387,
        "isocode": "FR",
        "proxy": "yes",
        "type": "Compromised Server",
        "risk": 100,
        "attack history": {
            "Total": 28594,
            "Vulnerability Probing": 28594
        },
        "last seen human": "1 hour, 19 minutes, 17 seconds ago",
        "last seen unix": "1560942310"
    },
    "query time": "0.02s"
}

As you can see there is a new section directly under the risk score which shows attack history. At the very top we're listing the total amount of attacks we've seen from this IP Address and then directly below we categorise each type of attack and display those counts. In this section you may encounter Login Attempt, Registration Attempt, Comment Spam or like in the example above Vulnerability Probing. We've detailed these and other response types on the API Documentation page under the risk score section.

These attack histories do not only display for detected proxies and VPN's. You could for example receive some attack history for an IP that we believe to be clean although if the attacks accumulate it will likely be displayed as a compromised server like the entry above which is a real reply from our API.

We've had a lot of requests from users over the past few months to add this data to the API and it was important to us that we did it in a way that won't impact service performance. This kind of data retrieval requires us to load information from our slowest storage medium where as most of our other data lives in fast server memory.

But we think we've come up with a good starting point. For an IP Address with a lot of attack history (such as the one above showing 28,594 attacks) we're seeing around a 0.02s query time. But for the vast majority of the IP Addresses out there you won't see any increase because the IP's either haven't generated any attack data or the attack volume is very small.

We hope you will take good advantage of the new attack data, we know some of you have gone to great lengths to try and obtain it, even going so far as to crawl our threat pages. Thankfully you won't have to do that anymore and the API version of this feature will provide a much wider range of data as it's not limited to 10 unique entries like our threat page attack history display is currently.

Thanks for reading and we hope everyone has a great week.


Email Alert Improvements and a CDN Caching Update

Today we've pushed a minor update which will bring about a quality of life improvement for our customers who prefer to make singular payments for service instead of being on our reoccurring billing system.

From today we'll send you an email a day before your paid plan is going to expire so you don't caught out. Prior to today we only sent you an email at the same moment your plan transitioned from paid to free which did cause some customers to go without full protection until they started a new plan.

Like our previous plan expired emails, these are tied to your email preferences within the customer dashboard, specifically the "Important emails related only to my account" email toggle.

So if you don't want to receive these kinds of alerts (for example you've chosen to cancel a paid plan as you don't need it anymore) you can simply toggle that email preference off and we won't send you any such notifications.


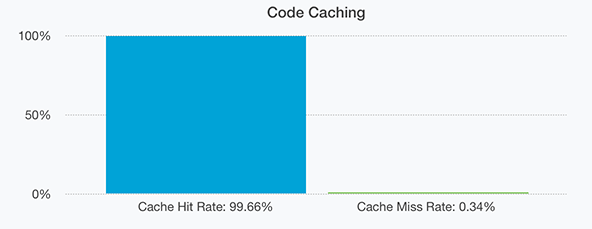
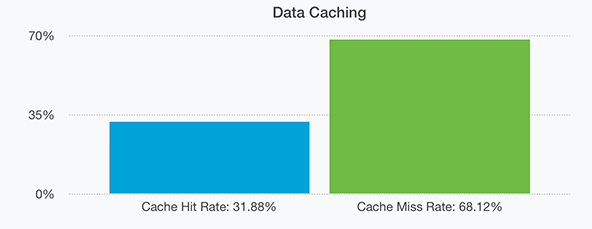
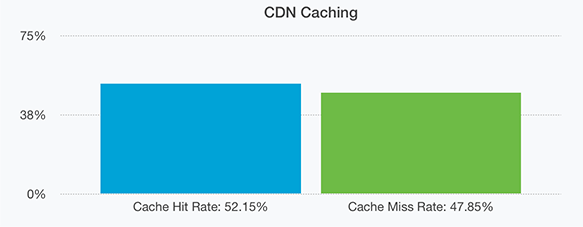
The second thing we wanted to talk about is our new CDN Caching that we introduced a few days ago to help smooth out peak loads and specifically handle DDoS attacks.

The good news is we've been able to significantly reduce load on our cluster by utilising caching at our network partner CloudFlare. In-fact we had another attack on our infrastructure recently and the mitigations held up quite well, service was not affected or disrupted. We've been tweaking the system and today we pushed live some changes to how it handles unregistered users (those without an API Key) so they have an even smaller impact on our service.

For registered users (both free and paid) this means a better quality of service overall as less resources need to be spent handling unregistered user queries.

Thanks for reading! - We hope everyone is having a great week.


New Statistics Synchroniser

As the proxycheck service has become more popular we've found that our prior syncing system was not living upto expectations. High CPU usage due to the volume of statistics needing to be processed and synchronised was the main problem.

To combat this issue in the past we added update coalescing which is where our servers each maintain a local object which stores all the raw statistics for a period of 60 seconds and then all our servers transfer their objects to the server that has been selected to process statistics for that time period (the server selected to process statistics is regularly rotated but to maintain database coherency only one server can perform writes at any one time).

This had worked well for the past few years but as we've grown this method wasn't enough on its own to combat this issue. Where as at the beginning we could update your stats within 90 seconds of you making an API query what we've found lately is that some statistics can take up-to an hour to show depending on the load level of the node that originally accepted your API query.

This is quite obviously unacceptable which is why today we've gone through and rewritten the way all statistics are synchronised. We're still using our local object approach with update coalescing but we've completely reprogrammed the methods for sending data, chunking data, checksumming data and verifying data.

The biggest change this brings is a significant reduction in CPU usage. Synchronising statistics had become such a burden that some of our servers were spending upto 25% of their CPU utilisation on statistic syncing. With the new system we're seeing huge reductions in CPU usage with around only 5-6% usage when handling the synchronisation of live customer statistics and that usage is over much briefer time periods, stats are now synchronised within just 2 to 3 seconds where as before we were seeing even in the best case scenarios syncing taking more than several minutes.

This change is live right now which means you should see every stat in your dashboard (and on our dashboard API endpoints) update much quicker.

Thanks for reading and have a great weekend!


Degraded Performance Yesterday and Mitigations

Yesterday between 7:30 PM and 10:30 PM GMT we experienced some highly degraded service with many of your queries taking upto 2.5 seconds to be answered if not dropped entirely.

This was due to a sustained attack against our infrastructure. In this case we were not the initial target of the attack, we were simply dragged into it due to one of our customers using our service to protect their game server. The individual[s] attacking our customer turned their attacks on us as a way to degrade the service level we were providing so that their attacks on our customers game server would be more effective.

The traffic we received was 9.5x higher than we ever would normally experience and was tuned for maximum resource depletion. Although our service did not completely go down and normal service resumed immediately once the attack stopped we did have severe service disruption which we intend to mitigate with two changes we have enabled today.

Firstly we're adjusting our per-second request limiter. Previously it allowed you to make between 100 and 125 requests per second with a resolution of 1 second (per node). We're changing this so that the resolution is now 10 seconds. The per second limit is still the same but with the added resolution range we can help our servers ignore bad requests for a longer period of time and this will help smooth out the kind of per-second peak loads that denial of service attacks create.

Secondly we've enabled request caching at our edge CDN (Content Delivery Network). This means every unique request you create will be cached for 10 seconds. This cache is per-customer so you will never receive cached content generated by another customer. The main benefit here is it will allow the same IP Address to be checked multiple times by a single customer without incurring requests to our servers.

We've made this second change because when our own customers suffer DDoS attacks they often send the same singular IP Addresses thousands of times a minute to our API which exhausts their query plans and creates undue load on our servers answering the same queries multiple times.

We're hopeful that both mitigations will help with future attacks but as always we will monitor the situation closely and alter our strategy as we see fit. We're also planning to add more servers into the cluster to further load balance this kind of peaking traffic.

Thanks for reading.


A Message About Intel's Microarchitectural MDS Vulnerability

Today there has been a revelation in the news about a new attack dubbed ZombieLoad which allows the exfiltration of data held in system memory by processes that shouldn't have access to that data on Intel systems.

Here is a quote from the ZombieLoad website:

While programs normally only see their own data, a malicious program can exploit the fill buffers to get hold of secrets currently processed by other running programs. These secrets can be user-level secrets, such as browser history, website content, user keys, and passwords, or system-level secrets, such as disk encryption keys.

One scenario where this can be exploited with wide-reaching ramifications is cloud hosting. When you rent a Virtual Private Server (VPS) from a cloud host such as Amazon, Digital Ocean, Google, Microsoft and many others you're actually sharing a virtualised piece of a larger system. And you will have neighbours on that system.

Normally the virtual machines are kept completely isolated from each other with files and memory kept separate by the host system. But with this attack you can break down those secure barriers and peek at what the other guests on the system are doing with their slice of the host resources. You can also peek at the host system itself revealing data encryption keys, root access keys and other data that should remain secret at all times.

Now the reason we're making this post is because we've already had some customers send us links to the new attack because they're concerned about how it affects us. Well we want to make clear, we're not affected because we do not use cloud hosting or virtual private servers for any of our core infrastructure.

All of our nodes within our main cluster are bare metal meaning we operate the entire physical server, we're not renting just a slice of it. That also means all customer data we have is held on bare metal servers and are completely safe from this new vulnerability. While it's true we use VPS's for our honeypots they do not hold any data beyond incoming attacks.

We specifically use a data-retrieve model for our honeypots where they collect and store attacks and then one of our core servers connects to the honeypot and downloads their data. At no point are any of these honeypots given access to the rest of our infrastructure. They hold no keys or credentials. We treat them the same way we would any untrusted third-party.

Thanks for reading and have a great week.


Spring Updates

This month we've been working mostly behind the scenes on various long term projects and today we'd like to share some of these with you so that you can get an understanding of how we're improving the service going forward and what investments we're making for our future.

Earlier this month we added a new server similar in nature to STYX which has a specific duty within our infrastructure. This new server is called HADES and it's an orchestration server. It handles all our server management duties including the scheduling of automatic software updates, the setup and provisioning of new servers and continued real-time monitoring of our entire infrastructure among other similar duties.

Essentially HADES allows us to do a lot of things in a completely automated way that could only be done semi-automated in the past. Which means by having HADES we can deploy a greater number of servers with the least amount of ongoing management burden.

This leads well into what we've been working on with honeypots. If you've visited our status page before you may have noticed at the bottom we list 20 of our own honeypots. These are virtual private servers we setup around two years ago to appear attractive to bots which are hunting for exploitable computers on the internet. The data provided by these honeypots has been invaluable to growing our unique datasets.

But we always want more data which is why we have been aggressively securing partnerships with sources of unique attack data. One reason for why this data is useful is because there is a very wide crossover between addresses being used for proxying and addresses being used for botting.

And our customer base is growing in the direction where it's not just good enough to only detect proxies and virtual private networks, our customers almost always want to block any non-human visitor to their site or service. They know that bots are a growing nuisance which are causing untold damage to infrastructure and loss of earnings.

Be it from employee time wasted cleaning web properties of spam comments, click fraud that destroys your ad revenue or devastating and automated exploit hunting that results in infrastructure compromises that hurt customer confidence in your business and lead to big financial ramifications.

All of this is why we've been putting a deep focus on what our API today lists as compromised servers. We have an opportunity to make the internet safer and at an affordable price so that no site or service need go unprotected.

And of course these new partnerships we've been making continue to respect our privacy obligations. The only data we're sharing with our new partners comes from our own honeypots and inference engine. We're not giving up any of your data or the data you entrust to us about your own customers.

These changes are all live as of this post and we've already grown our purview of bots by 25% this month and we see that only growing as we strike more partnerships going forward.

Thanks for reading this update and we hope you all have a great week.


Celebrating our 3rd birthday with new API Documentation!

On the 20th of April proxycheck.io reached its third year milestone. In that time we've served many billions of queries and added many features. To celebrate this occasion we decided to redo our API documentation so that it meets the level of quality that our service delivers. So let's go through some of the changes we've made.

  1. Each section of the API must be useful, less repeated information makes it faster to read.
  2. Anchor points throughout the document making it possible to link to specific sections.
  3. A side menubar which lets you click straight to the section you're interested in and follows your progress through the document.
  4. A moveable menubar so you can position it wherever you'd like it to be.
  5. Straight forward tables showing feature, limit and other breakdowns with colour formatting.
  6. A test console so you can try all the flags and status codes right in the document itself.
  7. Showcased coding libraries and their features so you don't waste time reinventing the wheel.

So lets get to the screenshots! - First we'd like to showcase our new side menus which not only track your position through the api documentation based on where your cursor is positioned but are also draggable to anywhere on the screen where they will stay. This is especially useful for users with small screens who may need the menus to overlay some of the document content.

Image description

The next thing we wanted to illustrate is our new library section where we feature many implementations of our API written by ourselves and other developers that you can use to jump start your own use of our API.

Image description

If you have created a function, class or library for our API that you would like us to feature in our documentation please contact us!

Now If you do decide to build your own client for our API then what better way is there to familiarise yourself with our formatting and status codes than to try them right in your browser. So we've included a new test console that lets you see every possible answer from our API with a high degree of customisability. Image description

We hope that you'll find these new features highly useful when developing for our API. We know that the documentation has needed these changes for some time and we've been planning to overhaul them since the beginning of this year. We spoke with multiple customers during the design of our new documentation page and they were instrumental in recommending changes and additions.

If you have any feedback please contact us and let us know, we would very much like to hear from you. Thanks for reading and we hope everyone has a great week!


Back