Around three weeks ago we enabled a new VPN detection engine on the backend of our service which aims to increase our detection rate of paid VPN services through more active scanning and crawling. And as of a few days ago we've activated its interface output on the latest v2 API endpoint (November 2020 aka the current release).
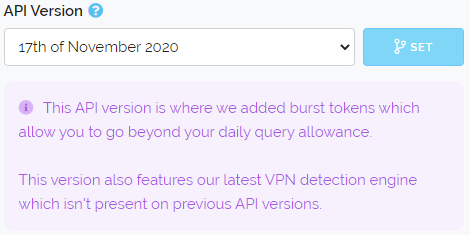
The reason we've not issued a new API version is because we only do that if the API response changes substantially enough to result in client implementation breakages or unintended behaviour. As the API response hasn't changed there's no need to update your client software. To access this new detection you simply need to have the latest release selected within your Dashboard (which is the default choice) or to select the November 2020 release as shown below.
So what warranted the new VPN detection and why now? - Firstly since 2017 we've been hard at work improving our VPN detection and we have reached many milestones during that time for instance inferring hosting providers based on their websites, self-maintained descriptors and peering agreements.
But the VPN landscape has changed over time. Now more than ever VPN companies are treating their servers like trade secrets especially as more services like ours make accessing content more difficult through anonymising services which is a marketing point VPN providers use to lure in customers.
We've seen a marked uptick in providers using smaller lesser known hosting providers that try to abstract that they're not residential internet providers. We've also seen VPN companies hosting servers in peoples homes in countries that have uncapped 1Gb symmetrical internet service, even from the biggest well known VPN providers. And finally we're seeing them use rack-space inside residential ISP datacenters to hide behind their residential IP ranges.
All of this presents a problem because these addresses are harder to find, change more often and reside in "safe" residential IP space that we traditionally have been reluctant to assign as VPN's because of the potential for false positives.
The main reason we see companies doing this is to allow streaming services to work for their VPN customers. Specifically services like Netflix, Amazon Video, Apple TV+ and Disney+. These services all block datacenter IP Addresses and so the need to move into residential IP space has become important to VPN companies that want to provide seamless coverage.
This is where our new VPN detection comes in. It's by far the most aggressive detection method for VPN's we have ever created. We're indexing the infrastructure of most VPN services on a constant basis in an automated way. By user share (popularity essentially) we believe we have 75% of commercial VPN services indexed and unlike our prior methods (which are still in use) it's much more targeted being able to pluck out just the bad addresses from a sea of surrounding good ones including when they exist in residential IP space and most importantly do it in a fully automated way that scales.
As we said above this new detection is live only on the latest API version so we would recommend making sure you're using that (and by default you will be unless you've selected an older API version). And our previous VPN detection methods are still in effect, this additional more targeted detection is to function in conjunction with our more broad approaches to increase overall detection rates.
The other change we've made today is regarding IP attack history. You may have seen something like below if you've looked at our detailed threat pages before:
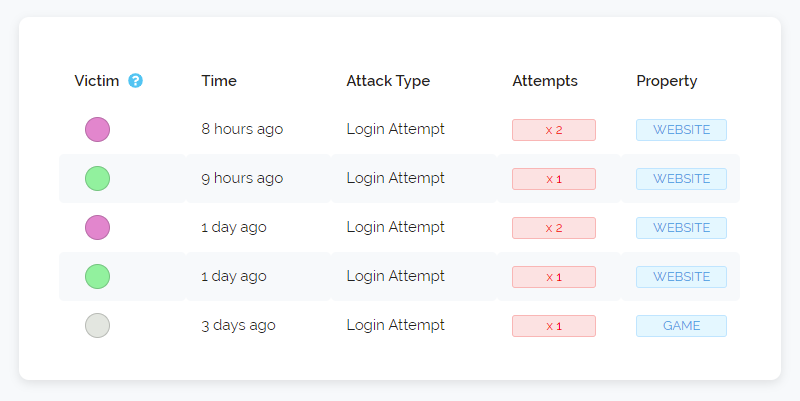
As we said above we're seeing more and more VPN's enter residential ISP space and one of the problems with that is those addresses are quite often dynamic meaning they are re-assigned to different customers quite often. So our pre-existing IP Attack History needs to be tweaked to be more aware of this.
We've added in some more intelligent weighting to how long history is stored and when it's displayed. Addresses that are consistently seen performing bad actions (automated signups, comment spamming, attacking our honeypots etc) will have their full history always available but addresses that are rarely seen doing bad things or that our system believes are part of a dynamic pool of addresses will have their history condensed to show more recent attacks and past bad history will be erased sooner.
We've also tweaked the risk scores that you'll see including for addresses with a lot of attack history but also for addresses we know are definitely running VPN servers but haven't yet been seen performing bad actions online.
So that's all the updates we have for you today, we know that VPN detection is very important to you all as it accounts for almost all the contact we receive from customers when they want to tell us about an address that slipped by our detection.
One last thing to mention about that, we really appreciate it when customers contact us about addresses we don't detect that we should be. We thoroughly investigate every address to determine how it got by us and what automated ways we can use to detect it and ones like it in the future.
This is why we recently updated the contact page to automatically fill out your email address for you in the web contact form. That small change may not seem like much but we have some incredibly dedicated customers who use this contact feature very often and anything we can do to speed up reporting helps them which helps us. We are aiming to have a more instant report button present on multiple pages and interfaces of the site sometime in the future so this is just a fast to implement intermediary change until then.
Thanks for reading and we hope everyone is having a wonderful week.