Today we're introducing a new category of data to our service called operators. This differs from our previously available providers data as it contains data about who is actually operating an address as opposed to who owns it in the internet address registry.
Adding this extra data is important because it adds context to our responses. Previously If you checked an address and it came back as a VPN you would only receive information about the registered owner of that address. The problem is the owner of that address is rarely the company responsible for running the VPN software from that address.
That is where our new operator data comes in. When checking an address that we know is being operated by a VPN company we will show that extra operator information in both our v2 API result and on our threat pages.
The data we'll be exposing through the API includes the operator name, the level of anonymity they offer, how popular the VPN service is, which VPN protocols they support and specific policies they have such as if they offer free or paid plans, accept anonymous payment options or offer port forwarding and adblocking.
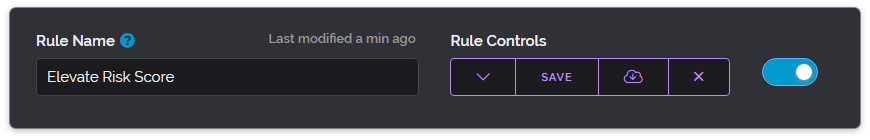
In addition to exposing this data through our API we've also added this data to the custom rules within the dashboard allowing you to block specific VPN operators by name or operators that allow anonymous payment options and the blocking of ads. In-fact we've added support for almost everything in the operator API response to be utilised by your custom rules.
We've also made some general improvements to the custom rule feature itself such as when setting a custom output modifier you can now add multiple pieces of information as a nested array. You can also convert singular values to arrays and then add to their contents. You can see how this is done on the right in the below screenshot.
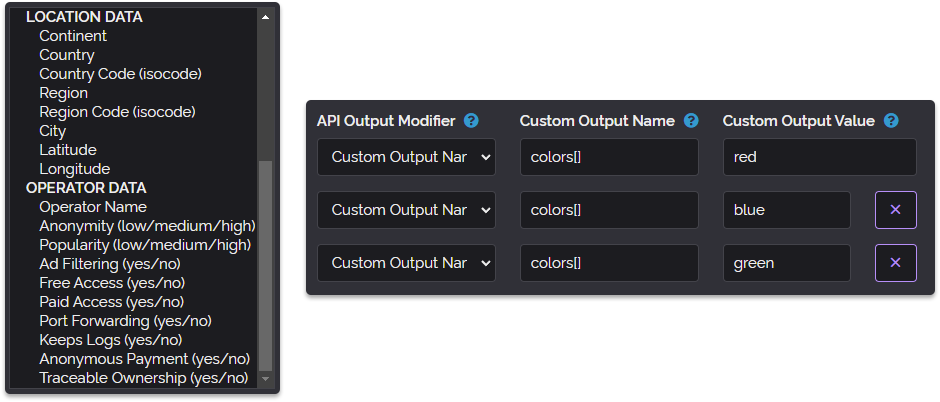
Additionally we've added categories to the API Provided Values dropdown within the condition section of custom rules as shown on the left in the above screenshot making it easier to find the data you want to use in your rule especially now that we have so many data providers.
Below we've included a screenshot showing one of the new operator cards that appear on our threat pages when using dark mode, there is of course a light version of these cards as-well.
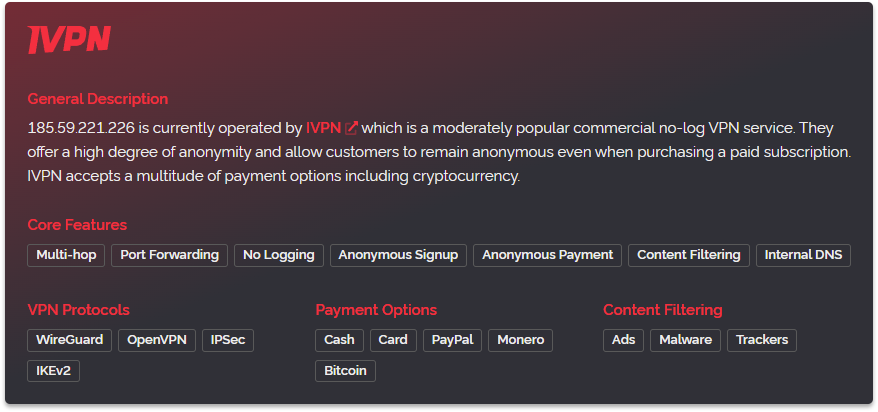
As you can see above the colors featured on the card match the logo of the operator to give a consistent appearance. You'll find this is present for all the operators we've profiled. For example here are some cards for NordVPN, CyberGhost and WeVPN. Three popular VPN operators with distinctive color use.
To access the new operator data via our API you merely need to be using the latest version of our API which is selectable from the customer dashboard version dropdown. If you're already set to always use the latest version then you will have been upgraded already.
This new API version is dated the 2nd of December 2021 and is manually selectable through the API directly when using the version flag, for example &ver=02-December-2021. This can be useful if you want to try the new API version without changing which version your production requests use.
So that's all the updates we have for you today. We would very much like for you to visit some of the links above so you can see the card designs for yourself and we hope everyone is having a great week.