Hello everyone, in mid September we asked you to fill our a survey and we included a link to the survey in the customer dashboard. We're pleased to say many of you did fill out the survey and we would like to share the results with you. We're also going to share some updated performance stats at the bottom of the post.
So in the Survey we asked you the following questions.
1. Has proxycheck.io helped your property stave off proxies and VPN's?
100% of all respondents selected "Yes, it often works" which is a great result. The other choices were it sometimes works and it never works so we're very happy that the service is working very well for everyone who took the survey.
2. How well do you consider the proxy detection?
- 50% selected 10
- 25% selected 9
- 12.5% selected 8
- 12.5% selected 7
We're happy that we did not score any 5 or below here, but clearly we can do better. 25% of our respondents voted between 7 and 8 and that's definitely lower than where we want to be. Though we are happy that 50% felt the proxy detection was perfect and 25% felt it was near-perfect.
3. How well do you consider the VPN detection?
- 62.5% selected 10
- 25% selected 9
- 12.5% selected 8
This surprised us as we feel that we're stronger on proxy detection than VPN detection but regardless we're very happy to see everyone vote 8 or higher for the quality of our VPN detection. We are of course still highly focused on improving all our detection types.
4. How do you feel about the plan pricing?
- 87.5% selected 1 which means "Very Affordable".
- 12.5% selected 10 which means "Very Expensive".
We do tend to agree with the 87.5% who said our pricing was very affordable. We didn't have anyone select between 2 and 9 in this question and perhaps some who voted were confused about the 10 and 1 being switched around in this question compared to the others. In any event we don't intend to increase our prices this year so we're glad that the overwhelming majority felt the prices were very affordable.
5. How easy have you found the proxycheck API to use?
- 62.5% selected 10
- 12.5% selected 9
- 12.5% selected 8
- 12.5% selected 7
We're glad to see that the majority feels the API is very easy to use. We can certainly make it easier through better documentation and providing more sample code, we're actively looking to partner with third party developers to get more examples, functions and libraries made for all manner of coding languages.
6. How easy have you found the proxycheck customer dashboard to use?
- 87.5% selected 10
- 12.5% selected 9
We're really happy here that so many felt the customer dashboard was easy to use. We have invested a lot of time into making it look great and usable. We've also listened to a lot of customer feedback to bring many features to the dashboard such as Two-Factor Authentication, Country data in the stats, searchable detection logs and more.
7. How have you found the proxycheck.io support? (Live Chat, Email etc)
- 87.5% selected 10
- 12.5% selected 9
Here again we saw some great responses with universal praise of our support. We're working to increase the hours we're available on support chat and answering emails faster than ever. In-fact 90% of all the support emails we receive are answered within 30 minutes.
Also we have been able to help many different customers through our live chat system for all manner of requests. Things like free trials, extending paid plans when our customers are having some temporary financial trouble, upgrading and downgrading plans with prorated differences and generally solving our customers issues in a convenient and fast way. I do believe our high customer service score is a reflection of our ability to get things done in a timely fashion.
8. Extra Feedback
In addition to the questions above we also asked customers to provide us with any extra feedback they wanted to write. Many of you wrote messages simply stating your love for the service its good monetary value and the level of support you've received. We're very grateful for these messages.
Some of you also took the time to write about features you would like to see added and issues you found around our website and API. We're happy to say that we added all the features that were requested and we fixed all of the issues raised within 24 hours of receiving each message.
For example we added searching and filtering to the positive detection log under the stats tab within your dashboard. This was as a direct result of feedback in the Survey. We also fixed some UI oddities like the placement of certain navigation buttons, these changes were done as a result of another customers survey answers.
Finally we fixed many minor issues around the site that caused console errors in web browsers. Mostly Javascript errors arising from the reuse of scripts from other pages but also some due to insecure content (Fonts loaded over HTTP) within secure pages. Nothing that broke functionality but things that did cause page errors and were important to fix.
We're very thankful to everyone that took part in the survey and especially to those who spent a lot of their time filling out very detailed answers for the extra feedback box, all of the information you provided was invaluable and we acted upon all of it very quickly.
Now apart from the Survey results we also wanted to share with you an update to our performance metrics. Back in May 2018 we showed you a graph which detailed the breakdown of our query answer times (including network overhead through our CDN partner CloudFlare) as a percentage.
Today we're updating this graph to show the work we've been able to accomplish since then through optimising our code and prioritising the checks that take the most time.
We're now answering 32.78% of all queries in under 25ms where as in May 2018 that was only 23.07%. If you look at the graph as a whole you can see we've maintained the 50ms, 75ms and 100ms leads with our new code while moving down those queries that were taking around 225ms and higher to the lower latency positions.
The big take away here is that 75.11% of all queries are now performed at or under 75ms. This is a big difference from our original code where only 9.69% of our queries were answered at or under 75ms and even a sizeable improvement over our May 2018 code where 51.18% were at or under 75ms.
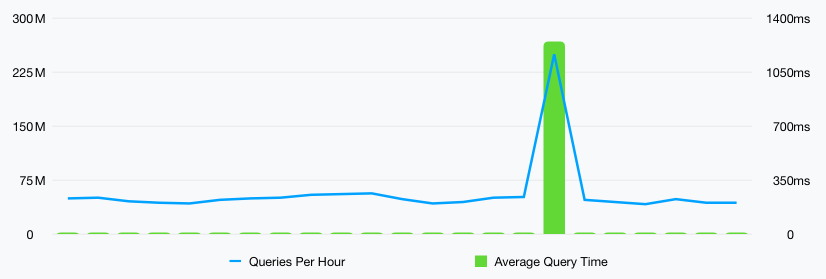
We're really happy with these improvements which make it possible to use our API in more latency sensitive deployments. We've also been able to accomplish these latency improvements while having the volume of queries we handle increase by several hundred million per day.
We're still optimising and looking for more ways to improve latency but we feel there is a night and day difference between where we were a year ago to now, it has been so vast that we've relaxed our per-request IP limit from 1,000 to 10,000 and we're fully comfortable doing that due to how performative the API has become over the past several months.
So that's it for this update, thank you again to everyone who took part in the survey and we hope you all had a great weekend like we did after seeing these results.