Today we'd like to share with you a new server we've added to our family called STYX, it joins HELIOS, PROMETHEUS And HELIOS within our cluster but it has a dedicated job, inference.
Specifically, post-processing inference. See we've run into a bit of a problem, the volume of incoming traffic we're receiving is now so vast that processing all of the undetected traffic is turning into a huge burden for our main cluster nodes to handle. They have to run the API, do live inference, host the website, coalesce, process and synchronise statistics and while doing all that they also have to go through a literal mountain of addresses and figure out which ones are running proxies as part of our post-processing inference engine.
Below is an illustration showing our current system where each node handles its own incoming addresses and then simply updates the other servers about any new proxies it discovers amongst that data.
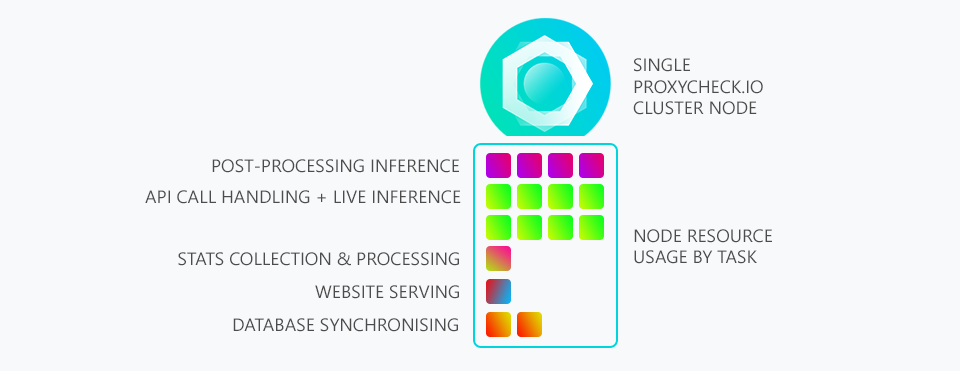
As you can see 50% of working time is spent on the API, as it should be. But 25% is spent on our post-processing inference engine. And recently this has meant we can only process 1/20th of the undetected address data we're receiving. This means if we find an IP that isn't already in our database there is only a 1 chance in 20 it will even get processed by our post-processing inference engine.
Now to fix this we've tried a lot of different things from precomputing as much data as possible and storing it on on disk, we've tried reusing inference data for common IP's (for example if two IP's are in the same subnet a lot of the prior computational work doesn't need to be done again). But all of this isn't enough because the volume of addresses being received is simply so high.
In addition to this we have a privacy commitment to our customers to only hold undetected IP information for a maximum of one hour. So we're up against the clock every time we receive an IP that needs to be examined by our inference engine.
So what is the solution? Well we've decided to invest in a new dedicated server with a lot of high performing processing cores and a lot of memory to specifically deal with this problem. We've ported our Inference Commander and Inference Engine software to this new standalone server where it can spend 100% of its time working on inference.
Below is an illustration showing how our three main nodes now have their addresses downloaded by our new server we're calling STYX before processing on its immense compute resources.
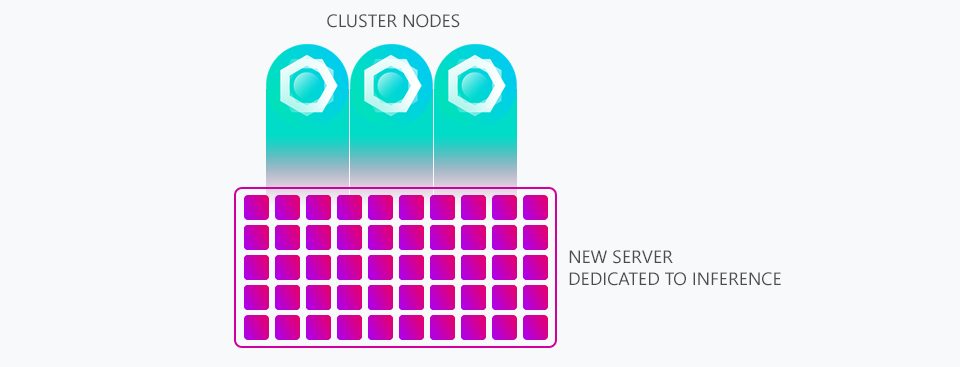
Already we've been able to move from processing only 1/20th of the addresses we're sent per day to processing 1/7th and we're confident we can increase it further until we're able to process every single address we're sent by carefully examining where the bottlenecks are and solving them. With this new server we can run it at 100% without worrying about other tasks suffering as it doesn't host our website or API, its sole purpose is inference.
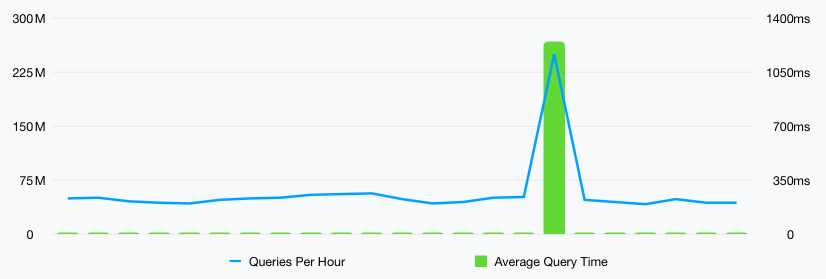
The other benefit of this new server is that it frees up the main nodes to handle more customer queries, we've already seen improvements in query answer times during peak hours and that directly correlates to being able to handle more queries per second.
Thanks for reading and we hope everyone is having a great week!
The following is an edit to this post made on the 7th of Feb 2019.
As of this update our new server is now processing 100% of all the undetected addresses we have coming in through our post-processing inference engine software. A big jump up from the 1/7th we originally quoted when this blog post was made. Over the past several days we have been tweaking and gradually increasing the volume of queries and today we have hit a more than sustainable processing threshold allowing us to process all incoming data. We're very happy with this and so we thought an update was in order :)
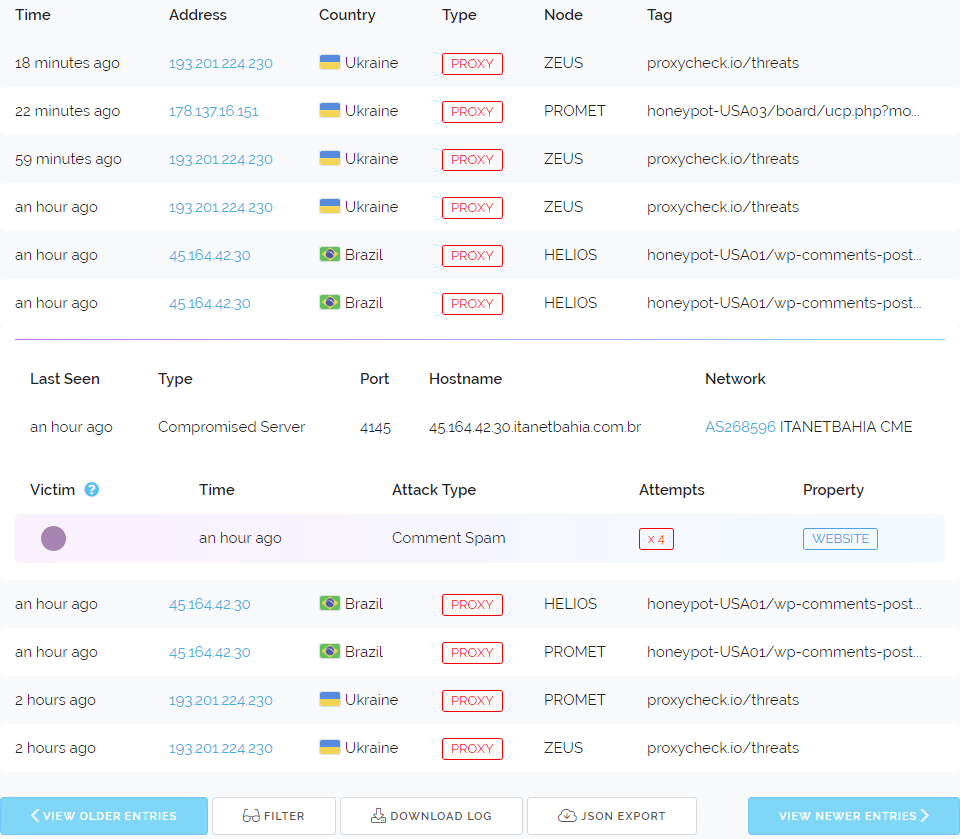
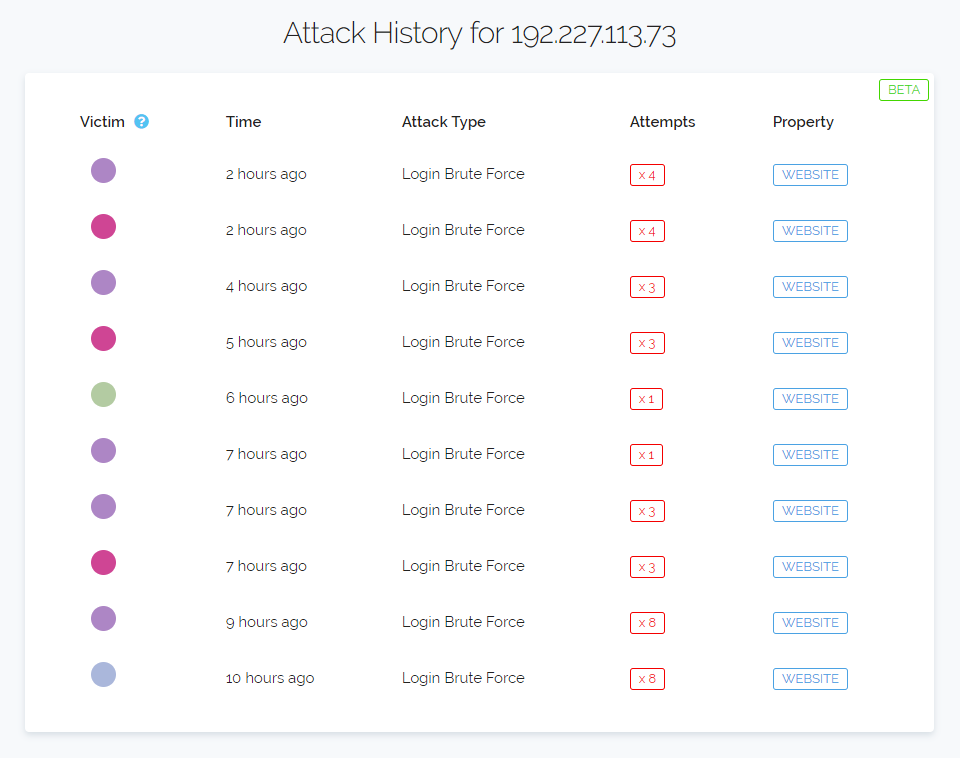 On the far left the colour dots represent the unique properties we're monitoring that saw attack traffic from the shown IP Address. The dots are not random but generated from the unique identifier we place on each individual property. This means you can use them to discern if an IP is just attacking one thing or many different things across the web.