Today we're introducing our second major post-launch update to the custom rules feature found within your customer dashboard and it's quite a substantial update, but before we get to that we would just like to tell you about the customer response to the custom rules feature.
Since we released the custom rules feature on July 17th we have received an enormous amount of feedback from customers. Infact it has become the most discussed feature within the conversations we hold with customers. This is why soon after launch we added more conditions and early in August in our first major update to the feature we added output variables.
Todays update focuses again on rule conditions. Previously every condition you added to a rule all had to be true for that rule to be acted upon. This meant you may have had to create more rules than you wanted simply due to your need to account for every possible situation.
Sometimes you just want to create a rule that only applies to a few different IP Addresses, Countries or Cities and you don't want to create individual rules for each scenario. While from the start we supported the supply of multiple values for a single condition (and this is still supported) it was not a great experience to fill such a small box with so much data and it also limited you to one specific condition type for all the values you supplied.
With this new addition of condition groups you can create as the name suggests a group of conditions where only a single condition within that group needs to be true for the entire group to be satisfied. This allows you to easily create rules which apply to a whole bunch of countries or addresses or any of our condition types allowing very powerful rule targeting.
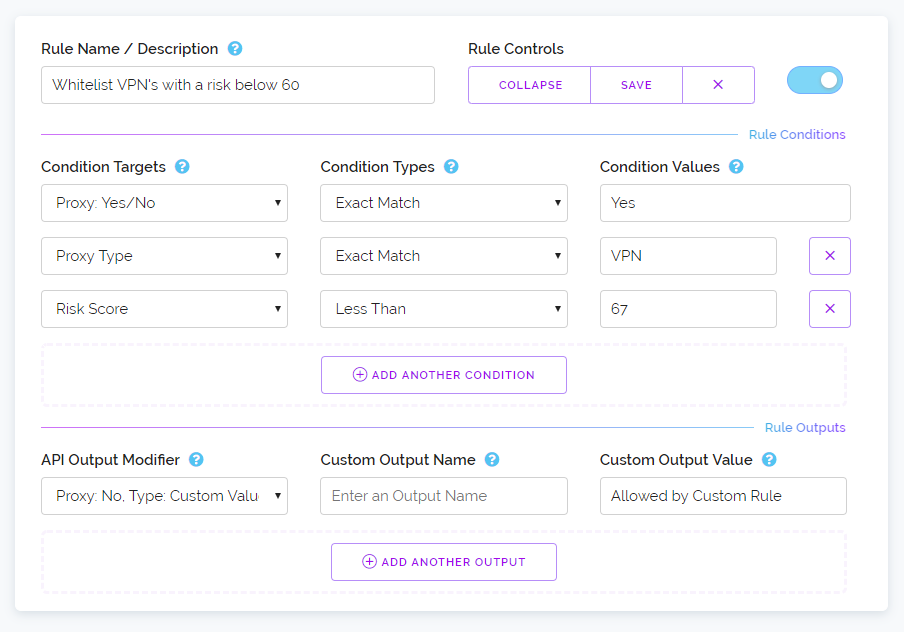
Below is a screenshot where we're creating a rule that only applies to a specific internet service provider in the United Kingdom. But we only want that rule to apply to three cities that they operate in and not the entire country. As you can see we've cleverly colour coded different conditions, pink conditions are required to be true while conditions wrapped inside a blue background only need a single condition within its group to be true.
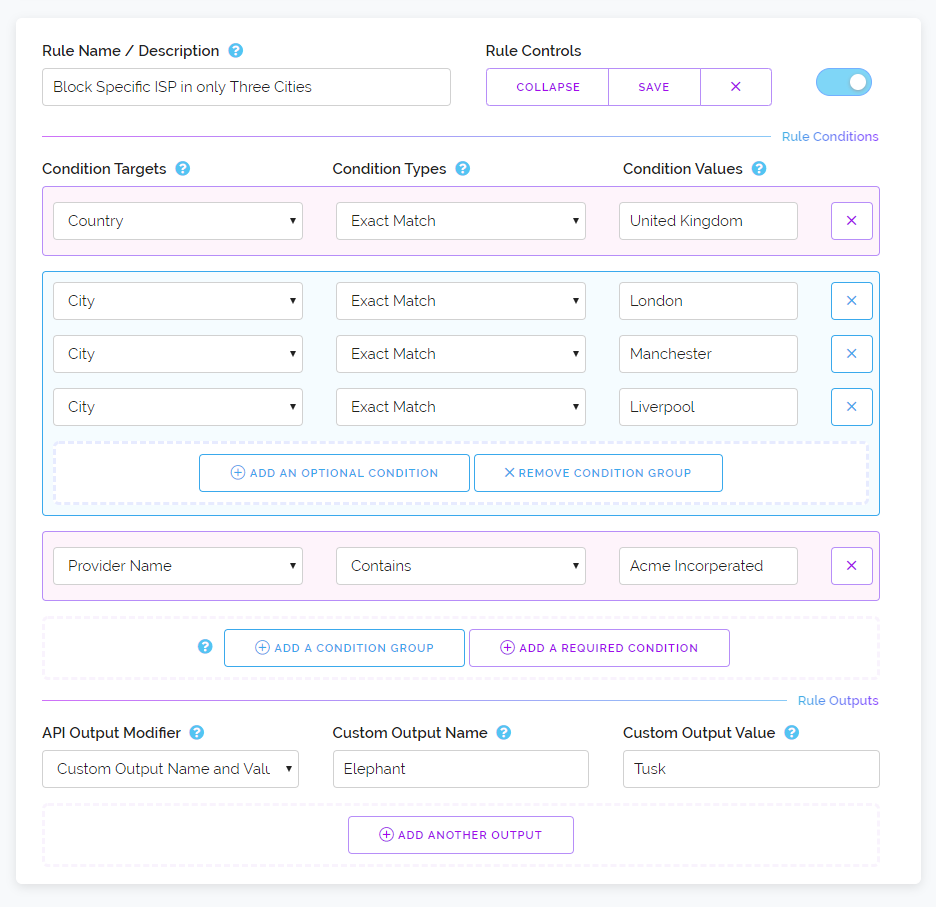
Now this rule will only be activated if the ISP and Country matches the entries in pink and also when any one of the three Cities in the condition group are seen. And as you can see on the left within the condition group there is a dropdown. You don't need all the conditions within the group to be the same type. We could substitute one of the Cities for something else like an ASN number or an address range.
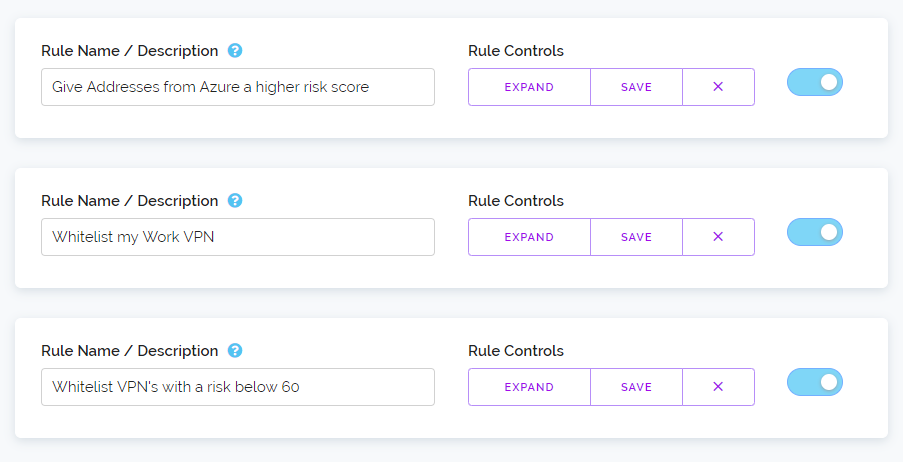
Like previously there are no limits on the amount of conditions you can specify for each rule and this extends to condition groups. You could if you wanted create your own whitelist or blacklist inside the rule feature using a single rule simply by creating a condition group and filling it with the Addresses, ASN's or IP Ranges you wish to whitelist or blacklist.
This update extends the foundation that the custom rules feature is built on. No functionality has been lost, you don't need to re-save your rules and the import/export features still work as you would expect. You can even import rules created with the previous version of the custom rules feature without issue.
This feature update has taken a lot of work but we know it's worth it. Customer response to Custom Rules as noted above has been phenomenal and it's our intention to keep adding new functionality over time with backwards compatible updates like this one so you can retain complete control of how our API interacts with your properties.
Thanks for reading and we hope everyone is having a great week.