Probably the biggest obstacle to overcome when operating a popular API such as ours is having the hardware infrastructure and software architecture to handle the millions of requests per hour that our customers generate.
Careful selection of our hardware combined with our extensive software optimisations have resulted in our ability to operate one of the internets most utilised API’s without turning to hyper-scale cloud hosting providers. That's important as it has allowed us to remain one of the most affordable API's in our space.
Today we wanted to talk about one very important part of our software architecture which is caching. We use caching not just for local data that is accessed often by our own servers but also at our content delivery network (CDN) to deliver repeatable responses.
During February we took an extensive look at all of our different levels of caching to see if there were more optimisations possible, which we found there were. We’ve also created a new feature we’re calling Adaptive Cache that by the time you read this will be enabled across all our customer accounts for your benefit.
So before we get into the new feature lets just quickly detail the three key areas where we employ caching today.
Server-side Code Caching
When our own code is first interpreted and executed the result is stored on our servers in memory as opcode and then those stored instructions are re-run directly instead of going through our high-level code interpreter.
This results in massive savings both computationally and time wise. In-fact if we didn’t do this a single request to our servers would take between 1.4 and 2 seconds instead of the 1ms to 7ms requests take currently.
Server-side Data Caching
Whenever you make a request to our servers and we have to access data from a database or compute new information from data held in a database we cache all of it. We cache any data we requested from our database and the computed answers you received.
This also dramatically increases performance as database operations are much slower than accessing things stored in memory and similarly it’s much faster to retrieve a computed answer from memory than it is to compute it again from the raw elements. This is one way we’re able to do real-time inference so quickly.
Remote CDN Caching
Whenever a request is made to our service our CDN stores a copy of our response and if the exact same request is made to us (same API Key, IP Address being checked, Flags etc) then the CDN simply re-serves that prior stored response. But only if both requests were made in the same 10 second window.
This is one of the most important levels of caching for our service when it comes to maximising the efficiency of our infrastructure because as you’ll see below we receive a lot of duplicate queries, mostly from customers not using client-side request caching.
So that’s the three main ways in which we utilise caching. Code, Data and Content. The main way we determine if our caching is working well is by monitoring cache hit rates. Which simply means when the cache is asked for something how often does the cache contain what we asked for.
Ideally you want the cache hit rating to be as high as possible and now we would like to share some numbers. Firstly code caching. This should be the type of caching with the highest hit rates because our code doesn’t change very often. At most a few source files are altered daily.
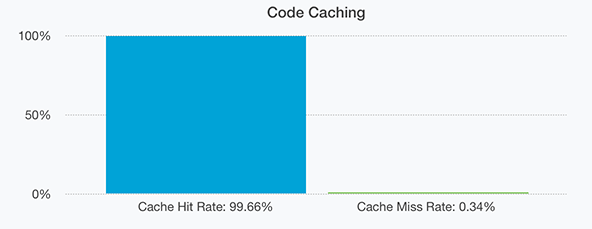
And as expected we have a cache hit rate of 99.66%. The 0.34% of missed hits are from seldom accessed code files that execute only once every few hours or days.
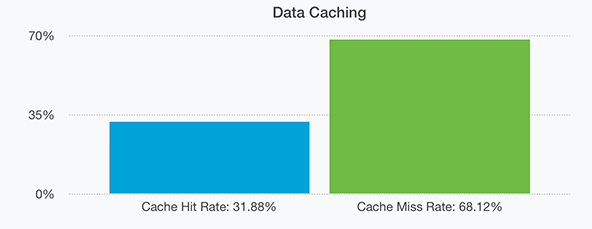
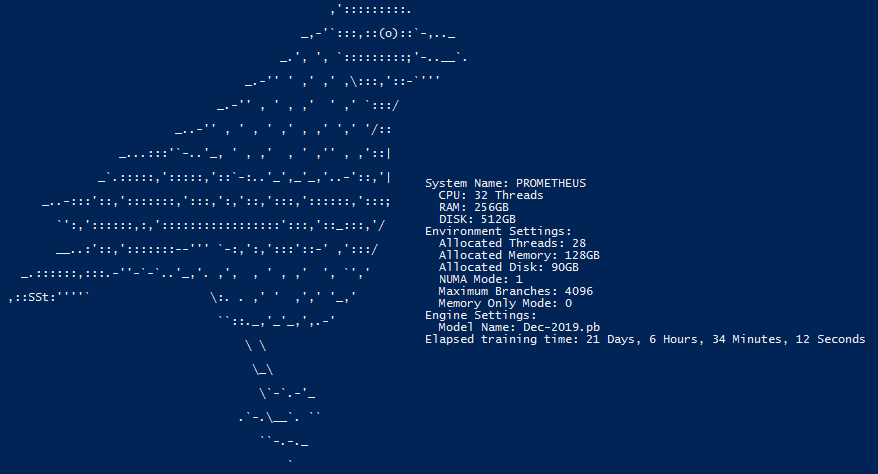
For data our hit rate is also quite high at 31.88% as seen above. This is mostly due to us having servers with enormous pools of memory dedicated to caching. In-fact all our servers now have at minimum 32GB of memory and we usually dedicate around 1/3rd of that to data caching (this is tweaked per-server to maximise the hardware present at each node, for example one of our nodes has 256GB of memory shared across two processors and a larger cache is more appropriate there).
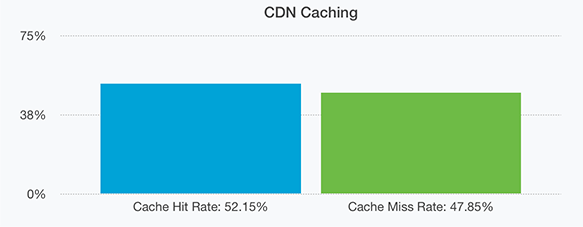
Finally and perhaps this will be the most surprising to our readers is our CDN cache hit rate. At 52.15% it’s extremely high. This means for every 2 requests we receive one of them is requesting data we already provided very recently (within the past 10 or 60 seconds depending on certain factors).
The reason we say this is extremely high is because for an API like ours that provides so many unique requests (literally millions every hour) it’s odd that so many of the requests we receive are duplicates, especially when our CDN cache is customer unique meaning one customer will never receive a cached result generated by another customers request.
So what causes this? it happens to be the case that many of our customers are calling the API multiple times with the exact same request due to a lack of client-side caching. The common scenario is a visitor comes to your website and you check their IP. They load a different page on your website and you check their IP again because the first result was not saved locally and cannot be used for the second page load. Thus generating two identical requests to our API, the first answered directly by our cluster while the second coming from our CDN only.
Now the good news is, the CDN we’re using (CloudFlare) is built to take this kind of traffic and since they have datacenters all over the world getting a repeated answer from them is usually going to be faster than getting it from our cluster. The other benefit is it saves you queries as we do not count anything served only from our CDN Cache as a query, they’re essentially free.
And so that brings us to todays new feature we’re calling Adaptive Cache. Prior to today we only cached requests made by registered users for a maximum of 10 seconds at our CDN. But with our new Adaptive Cache feature we’re now going to adjust the caching per-customer dynamically based on how many requests you’re making per second and how many of those requests are repeatable. This will save you queries and thus money and help us more efficiently utilise our cluster by answering more unique queries and spending less time handing out duplicate responses.
Essentially if you make a lot of repeatable requests but some of them are spread out too far from each other to fit within the 10 second CDN cache window we’ll simply increase the window size so your cache hit rate becomes higher. But don’t worry we’ll only adjust it between 10 seconds and 60 seconds.
It’s completely transparent to users and the system will always try to minimise the caching time so that changes you make in your account (whitelist/blacklist changes or rule changes for example) will be more immediately reflected by our API responses.
And so that brings us to to the end of what is a very long article on caching. If you want to optimise your own client that uses our API we highly recommend adding some kind of local caching even 30 to 60 seconds can save a considerable amount of queries and make your application or service feel more responsive for your own users.
Thanks for reading and we hope everyone is having a great week!