ASN data improved with city and coordinate information

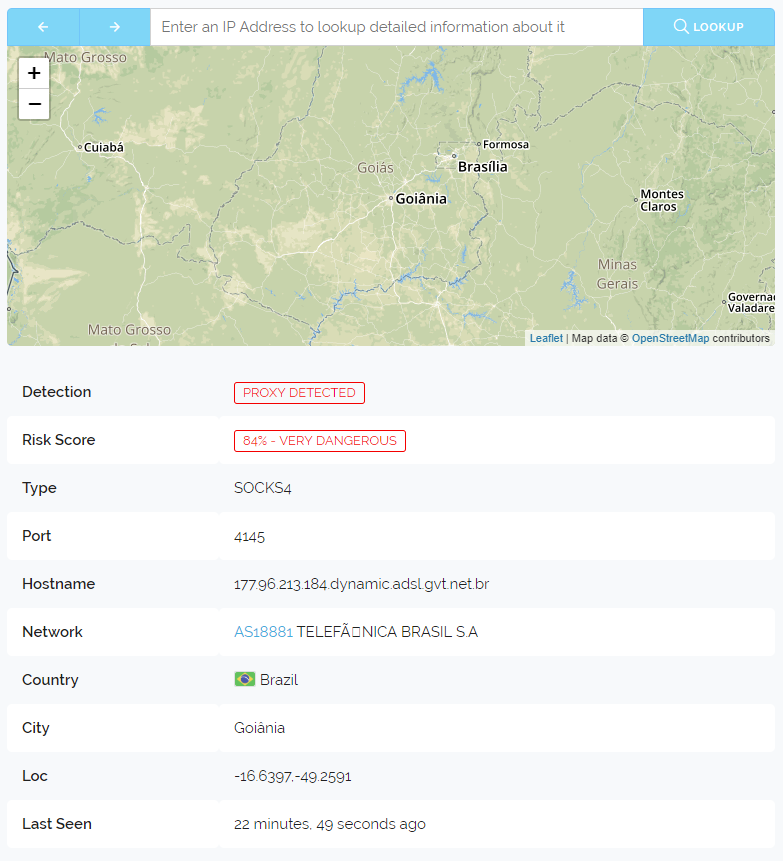
Today we've updated our v2 API endpoint to support the exposure of city and coordinate information alongside the previous country name and country isocode information. You'll find new examples featuring this data on our API Documentation page.

We have not changed our data formatting so any software you developed against our v2 API will remain fully functional but if you go back and make some changes you can now include the City (if applicable) and Latitude and Longitude in your software if you need it.

This has been an often requested feature and we're happy to be able to provide it to everyone today. Like all API changes this is accessible to all customers whether you're using a free or paid plan.

Thanks for reading and we hope everyone has a great weekend!


PHP composer library updated

Today we have updated our PHP composer library which adds support for viewing and altering your whitelist and blacklists in an easy way. Below is an example of how you would add three entries to your whitelist:

$proxycheck_options = array(
  'API_KEY' => '', // Your API Key.
  'TLS_SECURITY' => 0, // Enable or disable transport security (TLS).
  'LIST_SELECTION' => 'whitelist', // Specify the list you're accessing: whitelist or blacklist
  'LIST_ACTION' => 'add', // Specify an action: list, add, remove, set or clear.
  'LIST_ENTRIES' => array('8.8.8.8', '1.1.1.1/24', 'AS888') // Addresses, Ranges or ASN's to be added, removed or set
);

$result_array = \proxycheck\proxycheck::listing($proxycheck_options);

We have also made some changes to the whitelist/blacklist API to better support adding and removing multiple entries at once. We found that removing multiple entries at once was almost impossible before due to the way in which the search criteria was implemented, now it's much better and you should be able to remove lots of entries in a single query without any issues.

Thanks for reading and have a great day!


Infrastructure Deep Dive

Over the past year we've had a few customers ask us how our service is structured, what kinds of software we use and what custom solutions we've created to run proxycheck.io. As it's coming near to the end of the year we thought now would be a good time to take you inside our software stack.

To get started lets follow a request to our API from your server to our server.

Image description

So firstly our service is entirely behind CloudFlare's Content Delivery Network (CDN). So whenever you access our website or API you're first going through CloudFlare. As illustrated your request first goes to the closest CloudFlare server to your servers physical location. This is done using IP Anycast and is entirely handled by CloudFlare.

Image description

Once your request reaches CloudFlare it then enters their Argo Virtual Private Network (VPN). This is a service CloudFlare offers (for a fee) which uses dedicated network links between CloudFlare servers to lower network latency. Essentially we use Argo as a fast and low latency on-ramp to our servers.

This is what enables us to serve customers who are the furthest away from our cluster nodes while delivering acceptable network latency.

Image description

At this point CloudFlare chooses one of our geographically separated cluster nodes to send the request to and the CloudFlare server closest to that node performs the request and returns the answer from us to you back through the Argo VPN to the CloudFlare server closest to you.

Image description

But what actually happens inside our server? Well the above illustration explains. Firstly all our cluster nodes run Windows Server. We feel that Windows offers a lot of value and performance and we've found IIS to be quite a competitive webserver offering low CPU and Memory usage while being able to handle enormous amounts of connections. That isn't to say we think NGINX isn't good, in-fact we use NGINX running on Linux for our Honeypots and even CloudFlare uses NGINX for the connections they make to us.

Second to IIS is of course wincache which you can think of as opcache for Windows. It allows us to keep compiled PHP scripts in memory and re-run them without needing to re-run the PHP interpreter. This is very important for performance. You can also store user variables, sessions and relative paths in wincache but we don't usually make use of these features and instead rely on our own memcache implementation which we will detail below.

Third and Fourth is of course PHP v7.2 and our code which is written in PHP. You may think why didn't we use something more modern such as node.js, well we feel comfortable with PHP and the latest versions have been quite incredible when it comes to performance and features. Having over a decade of experience with PHP has given us great insight into the language, its quirks, its limitations.

Image description

Above is an illustration of what happens inside our code. We've tried to outlay each step in the program loop. All of this usually happens at or under 7ms for every "full" query (meaning all flags enabled). And in the case of performing a multi-query a lot of what happens on the left is only done once. This allows the latency per IP checked to go down dramatically when you check multiple addresses in a single query.

We will elaborate on the caching system and machine learning below.

Image description

We talked a bit above about our custom memcache system. You may be thinking why did we roll our own when we could have used memcached or redis? - Both quite common and well developed. Well we found that in the case of memcached its use of UDP as a mechanism to withdraw cached data wasn't consistent enough under high load scenarios.

So to explain what behaviour we saw, most of the test queries we performed would be answered in under 1ms with memcached. But sometimes we would have queries that took 1 second or even 2.5 seconds. We determined this was caused by its network communication system.

For a website those kinds of one-off latency hiccups are fine but for our usage those issues would add-up fast. After testing with it for more than a month we decided to roll our own system which relies on inter-process communication similar to an RPC call. Essentially we load an interface within PHP as an extension and that allows us to store and retrieve data as needed from our custom memcache process that runs separately on each server node.

Our memcache system also has some features you'll find in redis such as being able to write out cached data to persistent storage, network updates to keep multiple instances on different servers consistent and the ability to store almost any kind of data including strings, arrays, objects and streams.

In addition to those features it can also make use of tiered storage which means it can store the most frequently touched objects in memory and keep less frequently used objects on an SSD and then even even less frequently used objects on a hard disk. We've found this approach very beneficial for our large machine learning datasets where we try to pre-process as much information as possible so that query times remain low when utilising our real-time inference engine.

Image description

Which is a great segway into how our machine learning system works. We don't want to go into too much detail about what specific machine learning framework we're using or what models we're using but we can confirm we're using an open-source library. Above are some of the intelligence gathering methods our inference engine uses in determining whether an IP is operating as a proxy or not.

And we do want to elaborate on some of these as it may not be so obvious. For example "High Volume Actioning" due to our wide visibility over many different customer properties where they make use of our API combined with our own honeypots we're able to monitor unusual and high volume actions by singular IP Addresses, this could be signing up for many different websites, posting a lot of comments on forums and blogs, clicking on a lot of ads etc - Behaviours that are on their own not unusual but when done at a high frequency within a short time frame become suspicious.

Another we wanted to elaborate on is "Vulnerable Service Discovery". A growing number of Internet of Things (IoT) devices are being turned into proxies by criminals. These range from CCTV Cameras to Routers to general "smart" devices like home automation hubs, kitchen appliances and so on.

Our system during its probing and prodding of addresses discovers a great deal of compromised devices which either can be accessed by default credentials or have a vulnerability in their firmware which has yet to be patched that can allow an attacker to setup proxy serving software on the device.

Simply having a vulnerable device available isn't going to get an IP flagged as a proxy server but it does hurt that IP's reputation and it will be weighted along with the other data we have for that IP Address when the inference engine makes its final decision.

Finally we wanted to talk about "Automated Behaviour Detection" similar to the High Volume Actioning this is where we use our wide visibility and honeypot network to observe addresses performing web crawling, spamming, automated signups, captcha solving and other activity that fits botting behaviour. As bots have become more sophisticated and actually execute javascript within headless browsers it has become harder to stop them from accessing your web properties.

So detecting this kind of automated behaviour is extremely important and our model is designed to detect all kinds of automated behaviour through wide observation of incoming queries (combined with tag mining from our customer queries) and through our own honeypot network of fake websites, blogs, forums and more.

So we hope that you enjoyed this deep dive into our software stack. Obviously some parts we've had to hold a little close to our chest as we feel they give us a competitive edge (especially with regards to our machine learning) but we think we shared enough to give you some insight into what we're doing and how.

Thanks for reading and have a great week!


New upcoming payment notices

As our service has been offering subscriptions for quite a while now we've come across a few instances where customers forget that they're signed up for a subscription with us or they didn't realise the payments for their subscription are taken automatically as opposed to being paid by the customer manually.

Thankfully these instances where we bill someone without their knowledge are rare and in each case we have always issued an immediate refund once the customer contacts us about the situation.

But to eliminate this problem we've decided to be proactive about it by offering upcoming payment notices. And so within the customer dashboard starting today you'll see a new email toggle (which replaces our never used promotions toggle) which allows you to activate email notices for upcoming payments.

By default all new customers will have this toggled on, if you're an existing customer you'll need to enable it yourself. Also if you're subscribed to a yearly plan we'll still send you a notice regardless of this setting because we feel it's important that customers who hold a yearly subscription get these notices due to those plans being very expensive.

We don't want anyone to forget a payment charge is coming but we know for monthly subscribers receiving two emails every month (a notice of an upcoming payment and the receipt for payment) could get annoying so we've added this email setting toggle for those users who are subscribed monthly. Of course we'll always still send you payment receipts regardless of this setting.

Below is an example of what the email looks like.

Image description

We think it conveys everything succinctly and most importantly lets you know that you can cancel your plan from the dashboard to avert the upcoming charge.

Thanks and we hope everyone had a great Halloween! 🎃


New homepage, footer changes and dropping google ads

Today we've launched a brand new homepage with the goal of drawing in more users by showcasing our amazing customer dashboard which we feel is our biggest differentiator in this space and a great asset.

Remaking the face of your website, the home page everyone sees when they visit for the first time is a daunting task and we've been quite conservative with our changes over the past two years but today we've taken a big step and we're very happy with how it turned out.

If you're very perceptive you may also have noticed that we've cleaned up our footer navigation across the site by removing some redundant links and visual separators. A more obvious change is our removal of Google Ads.

The reason for removing all ads across the site is due to them not performing well enough to warrant us carrying them. For the software developer community that our product is made for the usage of ad-blocking software is extremely high which results in very low ad views when compared to our page views.

So from now on we will not be displaying any ads on the site, not from Google or any other ad network, we'll instead be subsisting purely on the revenue made from selling paid plans.

We hope you like these changes and please do check out the new homepage!


Invoice history added to the Dashboard

This has been an often requested feature, the ability to view and print out past and current invoices. Today we've added the feature to the customer dashboard under the Paid Options tab and this is what it looks like: Image description We will be showing your most recent 100 invoices here, due to that possibly becoming quite a long list we've also added a hide button. To keep the page loading quickly we are loading in the invoice log after the page itself is loaded so the dashboard won't be slowed down at all by this new feature.

That's it for this update we hope you enjoy the new addition!


What happened on October 19th?

If you visited your Dashboard yesterday you may have seen a notice at the top explaining we had a very bad server failure on our HELIOS node which had caused many stats related issues. Today we will explain this very unusual failure and what we learned from it.

So to begin with, HELIOS had been our longest serving node. We have had that server for many years and it has had some hardware failures in the past including two failed hard disks. Yesterday was the most difficult type of failure to deal with from a programmers perspective, bad memory. To fix it we replaced the Motherboard, CPU and Memory so effectively HELIOS is a new server.

When writing any software you are building on a foundation of truths and what is held in the computers memory is something you have to trust as that's where all your software is actually living. It's very difficult to program a system to self diagnose a memory issue when the self diagnosis tool itself will likely be affected by the memory problems.

And that is exactly what happened here. Our system is designed to remove malfunctioning nodes from the cluster but in this case HELIOS's bad memory was causing it to re-assert itself. It even tried to remove other nodes from our cluster thinking they were malfunctioning because its own verification systems were so broken it was interpreting their valid health responses as invalid.

The reason this affected our stats processing is because to keep our cluster database coherent, to stop conflicts caused by multiple nodes processing the same data at the same time we use an election process where every so often the nodes hold a vote and one healthy node is selected to process all of the statistics for a given time period. Due to the HELIOS node memory issues this voting process did not work as intended.

What we learned from this is that we needed a better way to completely lock out malfunctioning nodes from the cluster and we needed more points of reference for nodes to self diagnose issues and preferably to break themselves completely when they discover problems that would need human intervention instead of continuing to harm the cluster by remaining within it.

Today we think we've accomplished both of these goals. Firstly we've setup a lot of references in our health checks for self diagnosis that weren't there before. This isn't a foolproof solution but if any of the references are corrupted it shouldn't allow the nodes built in self management system to start arguing with the cluster and voting other nodes offline or at-least if it still has the working capability to perform votes it should neuter itself before attempting to vote on other nodes health status.

Secondly we've broadened our nodes ability to lockout bad nodes by revoking the tokens needed to be a part of the cluster group. This means good servers with a consensus can remove the "passwords" required to access the cluster by a malfunctioning node.

A third change that we've made is having known good nodes act faster when they are removed from the cluster while they're still functional by allowing them to initiate a confidence vote amongst the other nodes, this can be done in just a few seconds after they are removed from the cluster if the node thinks it's working correctly. Only nodes with perfect health scores over the past 3 minutes are allowed to vote in these decisions to reduce false positives caused by malfunctioning nodes.

Also we should mention although we only have three nodes listed in the cluster there is in-fact 5 nodes. Two of them do not accept queries and are not front-facing and instead work behind the scenes to manage the health, settle vote disputes and step in under another nodes name if there is a serious enough issue to warrant that.

We are of course disappointed that this failure occurred, many of you contacted support yesterday via live chat to express your concerns and we're very sorry that this happened. We're especially sorry to those of you who received overage notices due to the invalid query amounts that accumulated on your accounts and we hope you can accept our sincere apology for that. Our hope is that with these changes something like this will never happen again.

Thanks for reading and we hope everyone has a great weekend.


Minor stats issue yesterday evening through to this morning

Just a quick notice, yesterday evening we renewed some of our internal security certificates and although we set the new certificates to be applied to all three of our server nodes they were in-fact only applied to our prometheus node.

Due to this, customer stats including how many queries you've made and your positive detections were not being updated within your dashboard. The good news is, none of these stats were lost, they just weren't being processed, we have now corrected the certificate issue and all of your stats from the affected time period will now be reflected accurately within your dashboard.

We're sorry for the inconvenience this caused.


Survey Results and other Statistics

Hello everyone, in mid September we asked you to fill our a survey and we included a link to the survey in the customer dashboard. We're pleased to say many of you did fill out the survey and we would like to share the results with you. We're also going to share some updated performance stats at the bottom of the post.

So in the Survey we asked you the following questions.

1. Has proxycheck.io helped your property stave off proxies and VPN's?

100% of all respondents selected "Yes, it often works" which is a great result. The other choices were it sometimes works and it never works so we're very happy that the service is working very well for everyone who took the survey.

2. How well do you consider the proxy detection?

  • 50% selected 10
  • 25% selected 9
  • 12.5% selected 8
  • 12.5% selected 7

We're happy that we did not score any 5 or below here, but clearly we can do better. 25% of our respondents voted between 7 and 8 and that's definitely lower than where we want to be. Though we are happy that 50% felt the proxy detection was perfect and 25% felt it was near-perfect.

3. How well do you consider the VPN detection?

  • 62.5% selected 10
  • 25% selected 9
  • 12.5% selected 8

This surprised us as we feel that we're stronger on proxy detection than VPN detection but regardless we're very happy to see everyone vote 8 or higher for the quality of our VPN detection. We are of course still highly focused on improving all our detection types.

4. How do you feel about the plan pricing?

  • 87.5% selected 1 which means "Very Affordable".
  • 12.5% selected 10 which means "Very Expensive".

We do tend to agree with the 87.5% who said our pricing was very affordable. We didn't have anyone select between 2 and 9 in this question and perhaps some who voted were confused about the 10 and 1 being switched around in this question compared to the others. In any event we don't intend to increase our prices this year so we're glad that the overwhelming majority felt the prices were very affordable.

5. How easy have you found the proxycheck API to use?

  • 62.5% selected 10
  • 12.5% selected 9
  • 12.5% selected 8
  • 12.5% selected 7

We're glad to see that the majority feels the API is very easy to use. We can certainly make it easier through better documentation and providing more sample code, we're actively looking to partner with third party developers to get more examples, functions and libraries made for all manner of coding languages.

6. How easy have you found the proxycheck customer dashboard to use?

  • 87.5% selected 10
  • 12.5% selected 9

We're really happy here that so many felt the customer dashboard was easy to use. We have invested a lot of time into making it look great and usable. We've also listened to a lot of customer feedback to bring many features to the dashboard such as Two-Factor Authentication, Country data in the stats, searchable detection logs and more.

7. How have you found the proxycheck.io support? (Live Chat, Email etc)

  • 87.5% selected 10
  • 12.5% selected 9

Here again we saw some great responses with universal praise of our support. We're working to increase the hours we're available on support chat and answering emails faster than ever. In-fact 90% of all the support emails we receive are answered within 30 minutes.

Also we have been able to help many different customers through our live chat system for all manner of requests. Things like free trials, extending paid plans when our customers are having some temporary financial trouble, upgrading and downgrading plans with prorated differences and generally solving our customers issues in a convenient and fast way. I do believe our high customer service score is a reflection of our ability to get things done in a timely fashion.

8. Extra Feedback

In addition to the questions above we also asked customers to provide us with any extra feedback they wanted to write. Many of you wrote messages simply stating your love for the service its good monetary value and the level of support you've received. We're very grateful for these messages.

Some of you also took the time to write about features you would like to see added and issues you found around our website and API. We're happy to say that we added all the features that were requested and we fixed all of the issues raised within 24 hours of receiving each message.

For example we added searching and filtering to the positive detection log under the stats tab within your dashboard. This was as a direct result of feedback in the Survey. We also fixed some UI oddities like the placement of certain navigation buttons, these changes were done as a result of another customers survey answers.

Finally we fixed many minor issues around the site that caused console errors in web browsers. Mostly Javascript errors arising from the reuse of scripts from other pages but also some due to insecure content (Fonts loaded over HTTP) within secure pages. Nothing that broke functionality but things that did cause page errors and were important to fix.

We're very thankful to everyone that took part in the survey and especially to those who spent a lot of their time filling out very detailed answers for the extra feedback box, all of the information you provided was invaluable and we acted upon all of it very quickly.

Now apart from the Survey results we also wanted to share with you an update to our performance metrics. Back in May 2018 we showed you a graph which detailed the breakdown of our query answer times (including network overhead through our CDN partner CloudFlare) as a percentage.

Today we're updating this graph to show the work we've been able to accomplish since then through optimising our code and prioritising the checks that take the most time.

Image description

We're now answering 32.78% of all queries in under 25ms where as in May 2018 that was only 23.07%. If you look at the graph as a whole you can see we've maintained the 50ms, 75ms and 100ms leads with our new code while moving down those queries that were taking around 225ms and higher to the lower latency positions.

The big take away here is that 75.11% of all queries are now performed at or under 75ms. This is a big difference from our original code where only 9.69% of our queries were answered at or under 75ms and even a sizeable improvement over our May 2018 code where 51.18% were at or under 75ms.

We're really happy with these improvements which make it possible to use our API in more latency sensitive deployments. We've also been able to accomplish these latency improvements while having the volume of queries we handle increase by several hundred million per day.

We're still optimising and looking for more ways to improve latency but we feel there is a night and day difference between where we were a year ago to now, it has been so vast that we've relaxed our per-request IP limit from 1,000 to 10,000 and we're fully comfortable doing that due to how performative the API has become over the past several months.

So that's it for this update, thank you again to everyone who took part in the survey and we hope you all had a great weekend like we did after seeing these results.


Temporary degraded syncing

Due to a failing disk which significantly reduced database performance to only a few kilobytes per second our cluster has been finding it difficult to sync important data between nodes starting from mid day yesterday to early this morning. We did detect and correct this behaviour by taking the affected node offline and installing a replacement disk drive.

At no time were queries affected as all data accessed there is done so from memory for performance reasons. But new account creation, account changes such as adding/removing whitelist/blacklist entries were significantly delayed due to the slow syncing performance caused by the degraded disk.

We apologise to all customers that were inconvenienced by this problem, we should have taken the affected server offline sooner and we would have except it wasn't quite obvious to us at the time why the server was not syncing at the speed we expect it to.

Thank you.


Back