![]()
Today we're introducing some availability improvements that assist you in keeping your services fully available to your customers while utilising our API. The first of these changes is to do with API key management.
We've heard from some customers that they like to rotate their API keys on an annual basis. This is a good idea for security as it guarantees any leaked keys are no longer usable. But the problem has been if you change keys there will be a time frame where your software is still using your old key before you can input the new key.
This can result in denied queries or queries which don't utilise your custom rules or custom lists. For this reason, we've had a feature request which allows the old key to still be used after a new key is issued. And that is exactly what we've made available today. From now when changing your API key you'll be presented with the interface below which lets you specify how long your old key will remain usable.
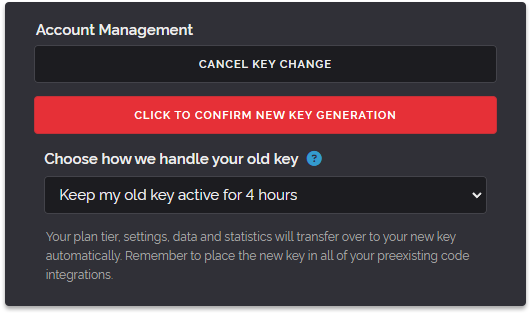
You can still choose to revoke your previous key immediately upon generating a new key but in addition, you can now choose to keep your previous key active for between 5 minutes and 8 hours by selecting a time frame that fits you from the dropdown box.
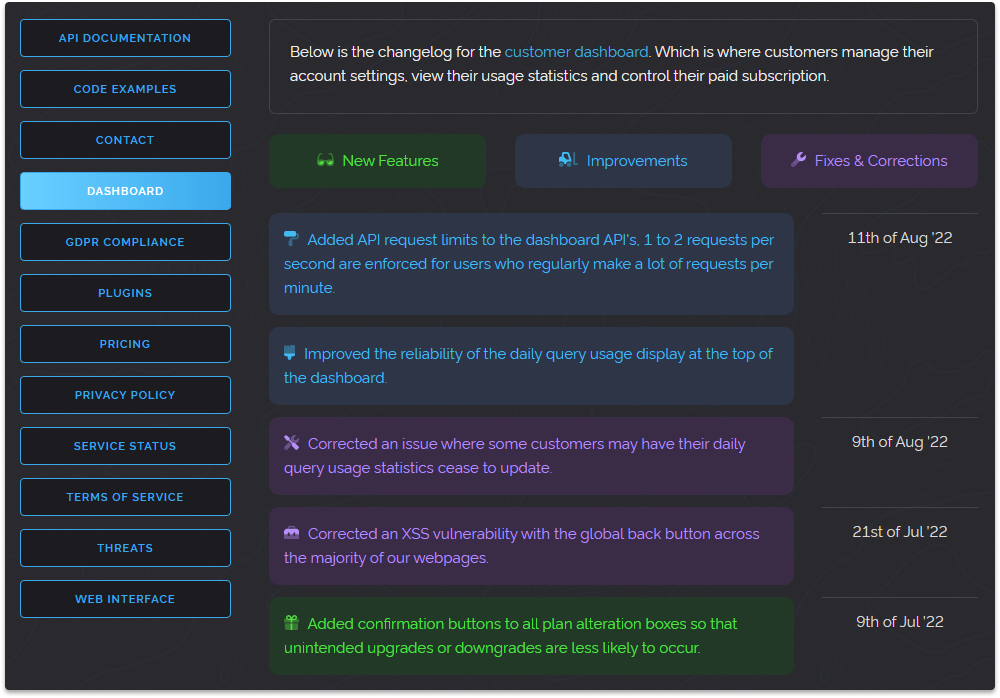
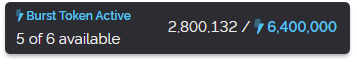
In addition to this change, we had another feature request to improve our Dashboard usage API so that it indicates if a burst token is currently in use or not. We've added this too as shown in the example below you'll now see a binary 0 or 1 to indicate if a burst token is active.
{
    "Burst Tokens Available": 6,
    "Burst Token Allowance": 6,
    "Burst Token Active": 0,
    "Queries Today": 1641,
    "Daily Limit": 640000,
    "Queries Total": 1588717,
    "Plan Tier": "Paid"
}
This brings the same activity status for your burst tokens to the Dashboard usage API as you can view in the Dashboard itself like in the screenshot below.
So that's all the updates we have for you today. We just wanted to reiterate that both of these feature changes are the result of direct feedback from our customers. If you have an idea please don't hesitate to contact us as we may just add it for you!
Thanks for reading and have a wonderful weekend.