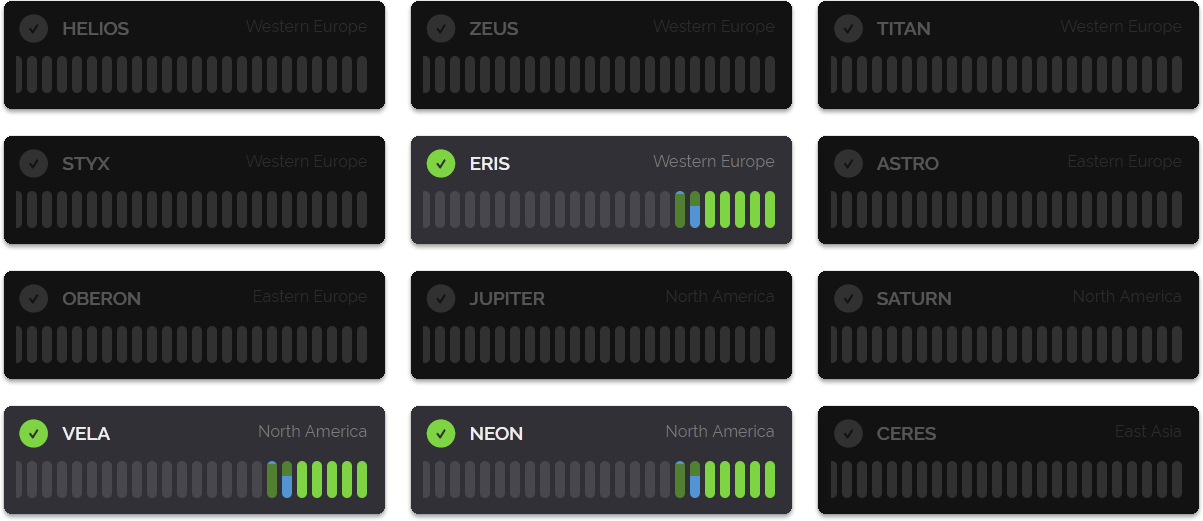
If you checked out our status page yesterday, you may have seen the display below, where we've highlighted three new servers.

And for the really observant, you may have noticed that NOVA and VEGA have been removed and in their place are NEON and VELA. Before we get into that, let's just detail the new European server, ERIS.
A few years ago, we introduced four extremely high-performance servers to our European cluster, and we consider Europe to be our "core" where other areas (North America, Asia, etc) fall back on. And it also serves our African traffic in addition to Europe.
So, having a lot of resources there is important, as the service has grown. Europe remains our highest source of daily queries, and so by adding the ERIS server node to that region, we're increasing total capacity by 25%. This also raises per-second request limits in the region. We didn't need to do this but it does increase our redundancy margin.
Now, let's discuss what happened to NOVA and VEGA. When we added them earlier this year, we used a new host that we hadn't used before in North America, and initially, it was great. The performance was consistent and high, and the reliability was also strong for both the hardware and the network.
But as time has gone on, we've been having more and more network connectivity problems and hardware issues, including data corruption. In fact, we had to make a status message about this on September 22nd, where the dashboard was failing to load for 25% of our users in North America. This was due to the VEGA server having corrupted files caused by either bad memory or failing storage.
After we resolved that, the issue came back a few days ago and this time not only on VEGA but on NOVA too. At this point, we decided to cut our losses, give up the servers and purchase new ones from a provider we've had more than a decade of experience with. The costs are higher, but reliability is something we're not willing to compromise on.
But these are not just replacements, these new servers are upgrades over NOVA and VEGA, with more cores, faster storage and a better network with lower latency and more bandwidth.
One thing we wanted to mention, we do not use hyperscalers like Amazon AWS, Microsoft Azure or Google Cloud. We find their performance lacking, prices too high and as seen earlier this week with Amazon AWS having a worldwide outage putting all your trust in a single provider can lead to catastrophe.
We use multiple hosts and many different geographically seperated data centers, even for the same service region, we also treat our server hosts like commodity providers which means we don't rely on their special-features, we build and maintain our own systems which lets us design in reliability from the beginning. We mentioned above how VEGA suffered data corruption and had to be removed from the cluster while it underwent repairs. The impact to the service was minimal and in-fact it was kicked from the cluster automatically which alerted us to the file corruption problem before it became an issue. Resiliency by design is how we've built our service from day one.
So that's the update for today. We've not always discussed our hardware changes, but we felt that with us adding three new server nodes in a single day, it warranted an explanation. We're also planning for the future; we intend to replace most, if not all, of our nodes in 2027, and we're targeting a 50% CPU performance uplift with those upgrades.
Now that is still two years away, so you may see us add some newer servers before then, but our focus is to not go above 5 servers per region if we can help it, so that means replacing older servers with newer ones over time that can handle more traffic.
Thanks for reading, and have a wonderful weekend!


