Dashboard Improvements: Log Filtering!

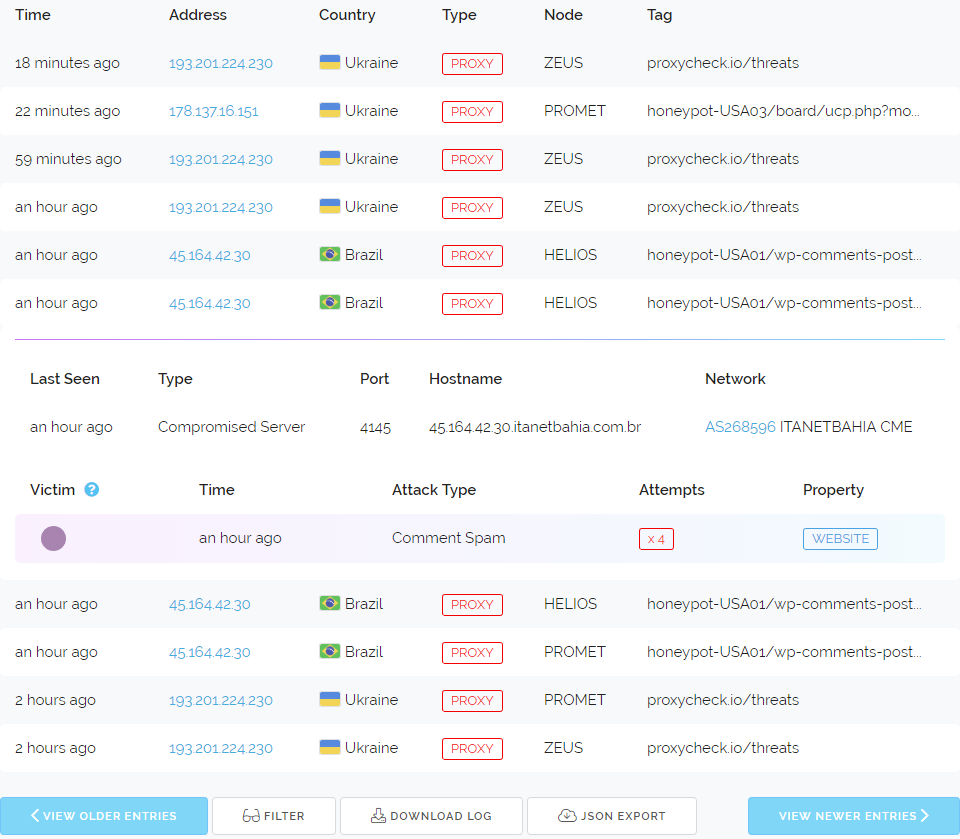
Today we'd like to share with you an update to the dashboards positive detection log as we've now added a powerful new filtering feature.

This change has been a direct result of your survey feedback, so please if you have some ideas you would like to see implemented contact us or fill out our survey here, we really do take your ideas into consideration.

Below is a screenshot showing us filtering by a country but you can also filter by time, date, address, node and tag. We've also provided a dropdown menu to quickly filter results by a specific detection type (All, Proxies, VPN's or Blacklisted results).

Image description

You may also notice if you're very perceptive that we've moved the "View Older Entries" and "View Newer Entries" buttons around. This was also done based on feedback provided through our ongoing customer survey. Someone made a very good point that the button placements were unintuitive and go against normal user interface conventions for traversing content so we've switched them around.

That's all the updates we have for you today, we hope you will all like the new filter feature, we're sure it will be a well used addition.


Inference Engine Improvements

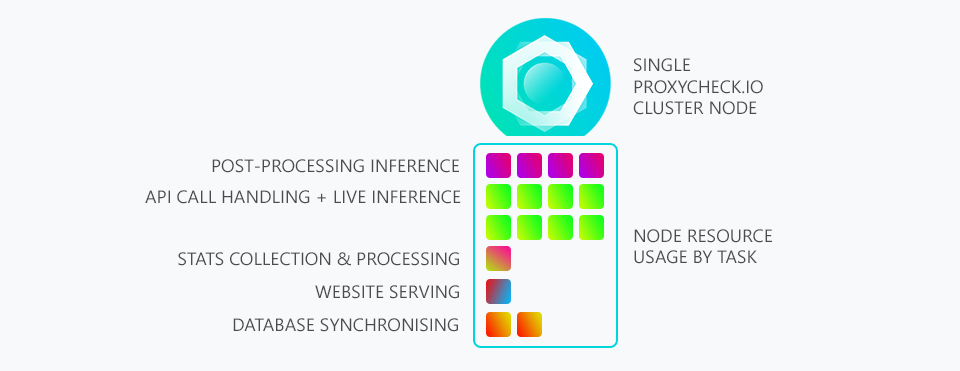
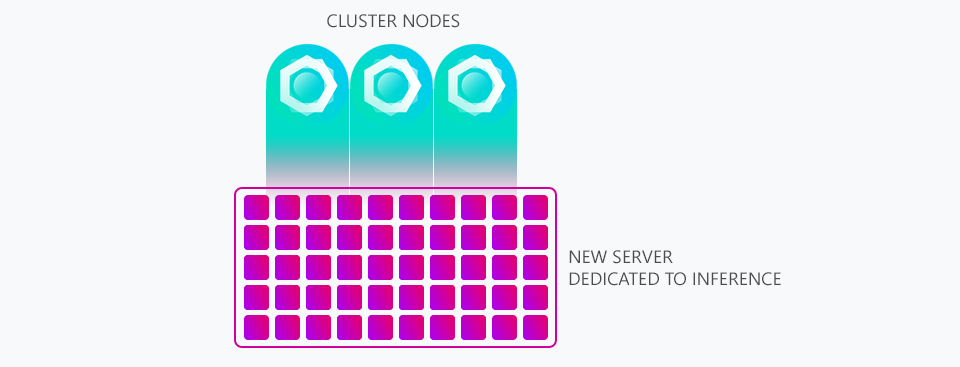
Over the past month we've been working diligently on our post processing inference engine. This is the machine learning system which does the heavy lifting on an IP after the real-time inference engine has made an attempt to determine if an IP is a proxy and then not made a positive detection.

Our main goal with the changes have been to dramatically reduce system resource usage whilst also gaining higher degrees of accuracy and better performance. We worked on the problem in three separate stages over the past month.

  1. Improve detection accuracy
  2. Increase performance
  3. Decrease resource usage

We achieved increased accuracy on the 14th of September. Since we implemented those changes we've seen more than a doubling in the detection rate with no increase in false positives. We achieved this by allowing the engine to spend more time per IP to make its determinations, increased use of pre-computed data (which we implemented on the real-time inference engine some months ago) and improved methods which we learned by examining old data, so we can lead the engine into better outcomes.

We increased performance by giving the engine the ability to create more simultaneous processes with which to process data. This had a detrimental affect on overall system performance because when we increased accuracy one of the ways we did that was by allowing the engine to spend more time processing an IP than ever before, in-fact we increased the time by 3x which had a direct correlation to how long the process running the engine must stay open and consuming resources.

So where as before our inference engine was using around 30-40% CPU on ZEUS and HELIOS and around 10% on PROMETHEUS (our strongest node) we found both ZEUS and HELIOS at 90-100% CPU usage and PROMETHEUS around 20-30%. This is obviously not good.

At first we tried to tune the engine using different configuration settings, placing limits on thread creation and so forth. But this only created issues where the engines running on all three nodes weren't able to clear incoming IP traffic fast enough and were falling behind.

So another approach was decided, we would scrap our old engine scheduler and create a new one which we're calling the Inference Engine Controller (I know it's a very unique name) and this perfectly balances and spawns different processes for our engine to use. Now we've never re-spawned processes per IP, that would be highly inefficient. But we usually have one process per 1,000 addresses.

With the new controller we can actually place a certain number of IP's in buckets together. Grouping addresses based on their subnet and ASN relationships. This dramatically speeds up inference time for closely matched addresses as much of the inference work doesn't need to be thrown away due to an IP having no relationship of any kind with the previous one that was just checked.

With us now dealing with hundreds of millions of checks per day there is a huge degree of similar addresses waiting to be processed, sometimes off by just one octet. In that kind of situation 99% of the inferred work only has to be computed once and can be used for both addresses resulting in a near instant determination for the second address.

So lets get to the results of all the work. Today we're seeing CPU utilisation of around 7 to 8% on ZEUS and HELIOS and around 1-2% on PROMETHEUS. All while being able to process 10x more addresses and with a much higher accuracy. Now again these changes are all for our post-processing inference engine so there isn't a performance improvement to the API, at-least not directly, although the lower CPU usage in general may help the API be more snappy and consistent.

We're still working on improving the inference engine and we hope to take some of what we've learned here and apply it to the real-time version in the future. We think the bucket-type system we've devised could be utilised on the realtime system if the queries per second to the API reach a certain threshold so that the availability of similar addresses is high enough to make it beneficial.

Another avenue we're looking at is storing inference data as a type of array in memory so that if an IP is similar to one already processed very recently the computational work used for that prior determination can be re-used by the real-time inference engine in the immediate moment, but more testing is needed to evaluate the latency impact of accessing an "inference map" even when held in fast system memory.

What we're describing above is decidedly different to the pre-computed data we currently store on disk for our real-time inference engine where just determinations are stored and not the inferred network data that came to that decision. That is something that is only really possible with IPv4 addresses and some (but nowhere near all) IPv6 addresses. By having the network determinations stored at every decisive stage in memory it allows inference about similar but different addresses to be performed without recomputing all of the work, that should in theory result in some fantastic speed improvements.

So that's all we have for you today, we've been quite busy over the past month working on this and we're really happy to share it with you now.


Take a survey and share your thoughts!

Although we often receive emails from customers where they ask us for features, tell us about bugs or other feedback we thought it would be a good idea to create a survey and ask our customers exactly what they think.

To take part simply click here no account is needed and we're not collecting email addresses. Simply make your selections and hit submit.

At the very bottom of the short survey we've included an optional feedback text field so you can write anything you want. Thank you everyone that takes part in the survey, it does mean a lot to us. We'll be linking to the survey in our customer dashboard for a short while aswell.


New threats page!

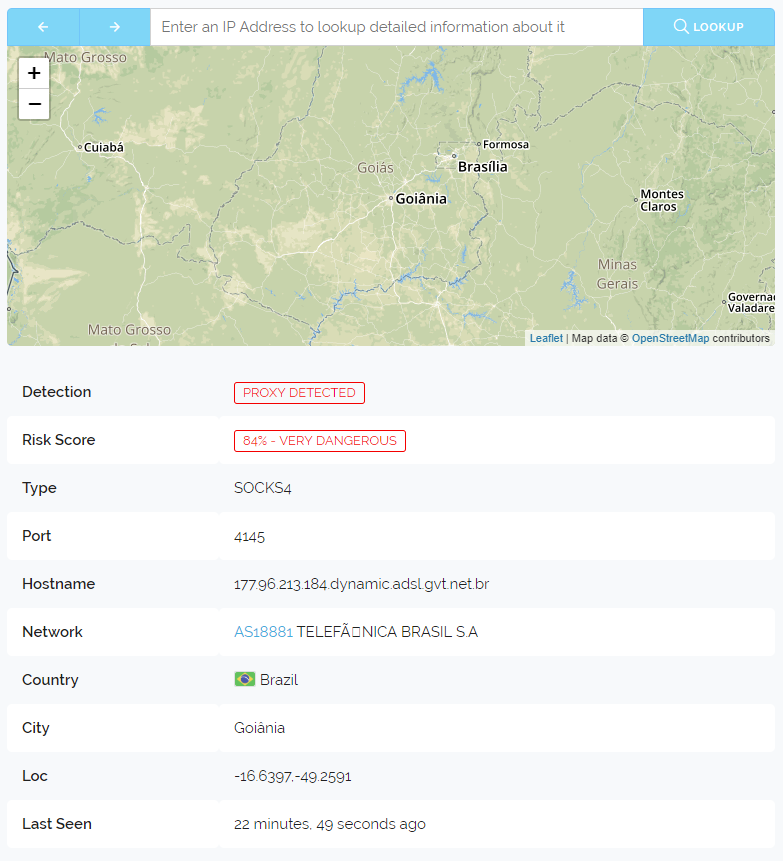
Today we've put live our new threats page which gives detailed information for specific IP Addresses. Similar to our web interfaces page but in a more eye pleasing and detailed presentation.

At the moment only the IP specific pages are live at the threats tab and in-fact if you visit the tab it will take you to your own IP addresses report by default. But we intend to add a live threat page there showing recent bad addresses that are attacking our customers infrastructure.

We're hoping the new threats pages will make the service more useful to the general public who are looking for specific IP information as the new threat pages can be indexed easily by search engines. We've also added links to the threat page for specific addresses shown within your dashboards positive detection log.

The page lookups work similar to the web interface in that queries made to it will incur against your querying address or API Key if you're logged in. We've done this to hinder web scraping, put simply it shares the same queries as your account this way.

We'll update you again once the main threats page is live, we're still working on that one.


Summer Cleaning

We think the saying is spring cleaning but we're almost through summer now. Over the past two days you may have noticed the site has gone through a lot of changes, especially the dashboard.

We've altered the appearance of many forms, added icons to most buttons across the site, improved the wording and formatting of emails and upgraded our previous site icon pack from Font Awesome 4 to Font Awesome 5 Pro.

We absolutely love Font Awesome and their newest icon series is the best yet, we've upgraded to their paid icons this time around (previous packs never had a paid option) because the new pro exclusive thin line icons are simply awesome.

We hope you all like the changes. We've had these in our development pipeline for quite a while since we did our last site appearance update on June 4th infact.

Thanks for reading and we hope everyone has a great weekend, we ourselves are taking the weekend off but we'll be back working on things on Monday.


Increased multi-check query limits, upgraded Web Interface and improved detection rates.

Today we've made a modification that some of our largest customers have been asking for, the ability to check more than 1,000 IP Addresses in a single query. This has been the limit since the v2 API was officially launched just over 7 months ago.

So today we've increased the limit from 1,000 to 10,000. This 10x increase should make it much easier for you to process older data, especially when you do it by hand through our Web Interface, however you are not limited to our web interface page as you can still perform multi-checks through the v2 API endpoint like normal.

In our testing we've found that as the volume of addresses in a single query goes up the time to process each individual address goes down. When checking 10,000 addresses for example we are seeing a processing time of 1ms per address (with network overhead not included of course). This is with all our flag based checks and results enabled.

We see a further decrease in latency to 955,000 nanoseconds (That's 9/10ths of one millisecond or 0.9ms). Per address check when just performing a proxy check with the VPN and ASN checks turned off. These latencies are incredibly low and that is the reason we've enabled the ability to check 10,000 addresses, essentially you can perform just a proxy check on 10,000 addresses in just 9.5 seconds and a full check with Real-Time Inference, VPN, ASN, Port and Type in 10 seconds.

In addition to this change, we know copying results from our Web Interface page has been annoying especially when you're checking a lot of addresses. Scrolling forever to be able to highlite three rows of 10,000 addresses would take a very long time. So we've added convenient copy to clipboard buttons to the far left of each result bar. Below we've included a screenshot.

Image description

The last thing we wanted to discuss was our improved detection rates. Over the past week we've been working hard on improving our detection of VPN service providers and proxy servers. To that end we've added 78 new datacenters to our VPN database and improved our proxy detection rate by 0.5%. Although that detection rate may not seem like much when we're dealing with hundreds of millions of queries per day that kind of improvement can have a big impact.

We would also like to thank the customers that have been sending us information about the VPN companies and datacenter hosts we haven't been detecting, this information is invaluable as we continue to build our database and we really appreciate the time you've taken to inform us.

That's everything for todays update. We hope everyone had a great weekend.


Plugin page updated and new JAVA example framework

Today we've gone through our plugin page and updated the styling and also removed plugins which don't support our v2 API which we launched seven months ago.

Below is a screenshot showing the new design.

We are taking both our code examples page and plugin page very seriously as they are very important to the growth of our API which is why we've spruced up the appearance of both pages and are committed to showcasing your work there.

In addition to the plugin page update we've also added a new JAVA framework to our code examples page which was written by DefianceCoding who also authored Anti-Proxy one of the Minecraft plugins featured on our plugins page.

We're incredibly grateful for his JAVA framework and I'm sure it will help many developers to integrate proxycheck.io into their products and services. And of course it's utilising the latest v2 API so you can get all the latest features exposed by our API.

That's it for this update we hope you're all having a great summer.


Changes to query tagging and logging

Today we have made two significant changes to our positive detection log which appears in your dashboard and both changes pertain to the tagging feature.

If you're unaware, the tag feature allows you to supply a small piece of text with each query you make for your own reference. We then display those "tags" back to you with the query in your dashboard if the query was detected as a Proxy Server, VPN Server or was Blacklisted by your own supplied blacklists within your dashboard.

The first change we've made is if you now supply the value 0 for your tag (aka &tag=0 in the URL) we will not save this specific query to your positive detection log even if it's a Proxy, VPN or a Blacklisted address. So essentially you can now turn off the positive log on a query-by-query basis.

This has been a feature requested by users who want complete privacy. By enabling this feature the IP's you test would never be held on our servers for more than a few minutes and not committed to any kind of log.

The second change is if your tag is blank, meaning you don't supply the tag query at all, we will only log this entry to your positive detection log if your storage use for positive detections is under 10MB for the current month.

So what that second change means is, if you tag your queries with a piece of text nothing changes for you, we will always log and save those for you regardless of how much storage it uses. But if you don't supply a tag of any kind we will not save them if you're using over 10MB of our storage for your positive detection log within the current month.

We've made this second change because sometimes users come under huge proxy based attacks. For example 5 to 10 million positive detections in a 24 hour period on a single account is not unheard of for us. Storing all of those positive detections can be burdensome as they take up GB's of storage space.

These changes are live across both our v1 and v2 API endpoints and the API Documentation page has been updated to reflect these changes as-well.

Thanks for reading and we hope everyone is having a great week.


v2 API adoption rate update

In late April we gave you the first update containing our v2 API adoption rate. To recap back then which was four months after the launch of our v2 API the adoption rate was 46.37% amongst our registered users and 79.54% of all queries made were to the v2 API.

The disparity between registered users who were utilising the v2 API and the volume of queries being made is due to our largest customers who made the most queries being the first ones to adopt the v2 API.

It's now July and it has been a full 6 months since our v2 API launched and the adoption rate has continued to increase quite significantly. As of today 72% of our registered users are now using the v2 API exclusively for all of their queries and 92% of all queries made to the API today were to our v2 API endpoint.

This upgrade rate is considerably higher than we were expecting at this point in time. At first we thought perhaps it was just due to new users but we've actually seen significant numbers of our prior v1 users upgrading to v2 driven mostly by third party software authors releasing new versions of their plugins which utilise our v2 API by default.

At current trends we're expecting more than 90% of our registered users to be on v2 by the end of this year. Another significant development which we haven't shared yet is overall usage trends.

Since April we have seen the volume of daily queries we process increase by four times. And yes you read that correctly, from late April to July 1st meaning two full months (May and June) the volume of queries we process every day increased four fold.

This isn't concerning as our infrastructure was designed to scale to these kinds of loads and in-fact our website and API are faster to respond now than ever before, including when compared to April. Through targeted code refactoring which focused on performance combined with configuration changes to our host systems (our cluster nodes) we've been able to absorb the extra traffic while delivering a better service overall.

We do not believe we need a forth node in the cluster yet, with all of the changes we've made that deal specifically with performance we believe we can comfortably serve around 2 billion queries per day before needing any extra servers and we have tested these kinds of load scenarios on the cluster to determine these numbers. Performance begins to degrade around 2.3 to 2.4 billion daily queries.

Whilst we don't publish exact numbers of how many queries we handle per day we can say it's between 100 Million and 400 Million daily queries. Every day we set a new record even if it's only by a couple million queries and mostly usage is predictable and steady allowing us to plan for future growth which includes sudden and dramatic usage spikes caused by some customers being under distributed attacks.

We hope this post was interesting, we couldn't be more happy with the adoption rate of our v2 API and also overall usage. We continue to believe we're offering the best bang for your buck and the numbers keep reaffirming that belief.


General Enhancements

Over this past month we've been focusing our efforts on enhancing various features and we'd like to share with you a few of those changes.

Firstly, the stats tab in the dashboard has had its backend significantly changed so that it can support customers with very large positive detections. It's becoming common for our largest customers to have several million positive detections made per day and we found there was a performance bottleneck that could take them a very long time to display within the stats tab, we have now resolved this problem.

So if you have quite a lot of positive detections you'll now find the log and country display on the stats tab both load much faster than before and all of your data is still available. These speed improvements also extend to the JSON export feature.

Secondly, we've updated our API documentation page with a new section which contains an array of all the possible countries you could receive in a response from our API when using the ASN flag. This has been requested quite often by customers through our support channels and so we thought it was prudent to include it on the API documentation page.

The last thing we wanted to mention is customer feedback for our new "last update" feature that appears on most of our webpages. We launched it at the start of this month and so far all the feedback we've received has been highly positive, customers really like the ability to see what changed especially on policy pages like our Privacy Policy and GDPR pages.

Thanks for reading and we hope everyone has a great week, we will be sharing some v2 upgrade statistics with you in our next blog post in early July.


Back