Over the past month we've been working diligently on our post processing inference engine. This is the machine learning system which does the heavy lifting on an IP after the real-time inference engine has made an attempt to determine if an IP is a proxy and then not made a positive detection.
Our main goal with the changes have been to dramatically reduce system resource usage whilst also gaining higher degrees of accuracy and better performance. We worked on the problem in three separate stages over the past month.
- Improve detection accuracy
- Increase performance
- Decrease resource usage
We achieved increased accuracy on the 14th of September. Since we implemented those changes we've seen more than a doubling in the detection rate with no increase in false positives. We achieved this by allowing the engine to spend more time per IP to make its determinations, increased use of pre-computed data (which we implemented on the real-time inference engine some months ago) and improved methods which we learned by examining old data, so we can lead the engine into better outcomes.
We increased performance by giving the engine the ability to create more simultaneous processes with which to process data. This had a detrimental affect on overall system performance because when we increased accuracy one of the ways we did that was by allowing the engine to spend more time processing an IP than ever before, in-fact we increased the time by 3x which had a direct correlation to how long the process running the engine must stay open and consuming resources.
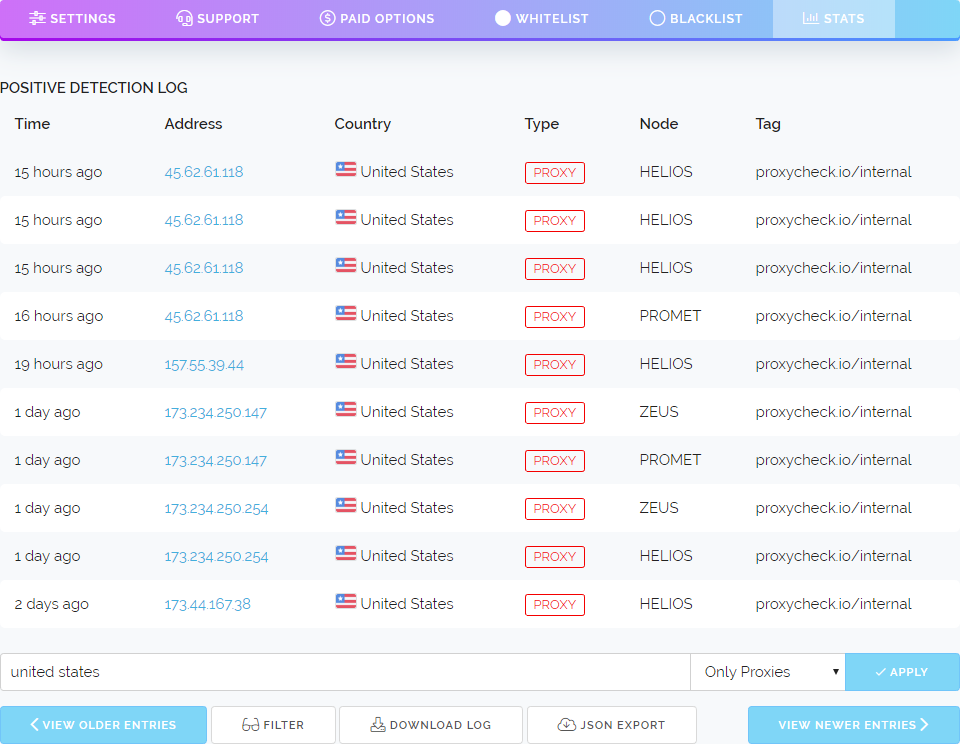
So where as before our inference engine was using around 30-40% CPU on ZEUS and HELIOS and around 10% on PROMETHEUS (our strongest node) we found both ZEUS and HELIOS at 90-100% CPU usage and PROMETHEUS around 20-30%. This is obviously not good.
At first we tried to tune the engine using different configuration settings, placing limits on thread creation and so forth. But this only created issues where the engines running on all three nodes weren't able to clear incoming IP traffic fast enough and were falling behind.
So another approach was decided, we would scrap our old engine scheduler and create a new one which we're calling the Inference Engine Controller (I know it's a very unique name) and this perfectly balances and spawns different processes for our engine to use. Now we've never re-spawned processes per IP, that would be highly inefficient. But we usually have one process per 1,000 addresses.
With the new controller we can actually place a certain number of IP's in buckets together. Grouping addresses based on their subnet and ASN relationships. This dramatically speeds up inference time for closely matched addresses as much of the inference work doesn't need to be thrown away due to an IP having no relationship of any kind with the previous one that was just checked.
With us now dealing with hundreds of millions of checks per day there is a huge degree of similar addresses waiting to be processed, sometimes off by just one octet. In that kind of situation 99% of the inferred work only has to be computed once and can be used for both addresses resulting in a near instant determination for the second address.
So lets get to the results of all the work. Today we're seeing CPU utilisation of around 7 to 8% on ZEUS and HELIOS and around 1-2% on PROMETHEUS. All while being able to process 10x more addresses and with a much higher accuracy. Now again these changes are all for our post-processing inference engine so there isn't a performance improvement to the API, at-least not directly, although the lower CPU usage in general may help the API be more snappy and consistent.
We're still working on improving the inference engine and we hope to take some of what we've learned here and apply it to the real-time version in the future. We think the bucket-type system we've devised could be utilised on the realtime system if the queries per second to the API reach a certain threshold so that the availability of similar addresses is high enough to make it beneficial.
Another avenue we're looking at is storing inference data as a type of array in memory so that if an IP is similar to one already processed very recently the computational work used for that prior determination can be re-used by the real-time inference engine in the immediate moment, but more testing is needed to evaluate the latency impact of accessing an "inference map" even when held in fast system memory.
What we're describing above is decidedly different to the pre-computed data we currently store on disk for our real-time inference engine where just determinations are stored and not the inferred network data that came to that decision. That is something that is only really possible with IPv4 addresses and some (but nowhere near all) IPv6 addresses. By having the network determinations stored at every decisive stage in memory it allows inference about similar but different addresses to be performed without recomputing all of the work, that should in theory result in some fantastic speed improvements.
So that's all we have for you today, we've been quite busy over the past month working on this and we're really happy to share it with you now.