Over the past year we've had a few customers ask us how our service is structured, what kinds of software we use and what custom solutions we've created to run proxycheck.io. As it's coming near to the end of the year we thought now would be a good time to take you inside our software stack.
To get started lets follow a request to our API from your server to our server.
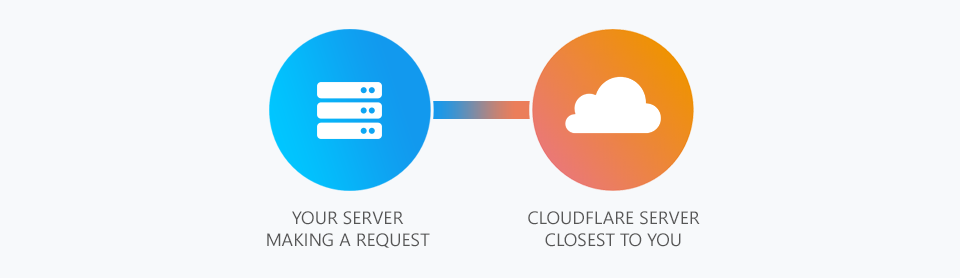
So firstly our service is entirely behind CloudFlare's Content Delivery Network (CDN). So whenever you access our website or API you're first going through CloudFlare. As illustrated your request first goes to the closest CloudFlare server to your servers physical location. This is done using IP Anycast and is entirely handled by CloudFlare.
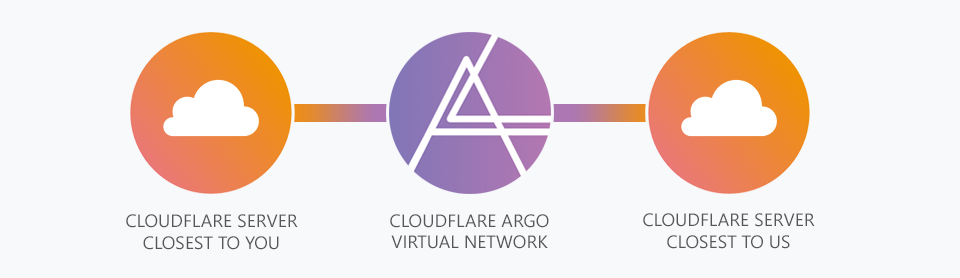
Once your request reaches CloudFlare it then enters their Argo Virtual Private Network (VPN). This is a service CloudFlare offers (for a fee) which uses dedicated network links between CloudFlare servers to lower network latency. Essentially we use Argo as a fast and low latency on-ramp to our servers.
This is what enables us to serve customers who are the furthest away from our cluster nodes while delivering acceptable network latency.
At this point CloudFlare chooses one of our geographically separated cluster nodes to send the request to and the CloudFlare server closest to that node performs the request and returns the answer from us to you back through the Argo VPN to the CloudFlare server closest to you.

But what actually happens inside our server? Well the above illustration explains. Firstly all our cluster nodes run Windows Server. We feel that Windows offers a lot of value and performance and we've found IIS to be quite a competitive webserver offering low CPU and Memory usage while being able to handle enormous amounts of connections. That isn't to say we think NGINX isn't good, in-fact we use NGINX running on Linux for our Honeypots and even CloudFlare uses NGINX for the connections they make to us.
Second to IIS is of course wincache which you can think of as opcache for Windows. It allows us to keep compiled PHP scripts in memory and re-run them without needing to re-run the PHP interpreter. This is very important for performance. You can also store user variables, sessions and relative paths in wincache but we don't usually make use of these features and instead rely on our own memcache implementation which we will detail below.
Third and Fourth is of course PHP v7.2 and our code which is written in PHP. You may think why didn't we use something more modern such as node.js, well we feel comfortable with PHP and the latest versions have been quite incredible when it comes to performance and features. Having over a decade of experience with PHP has given us great insight into the language, its quirks, its limitations.
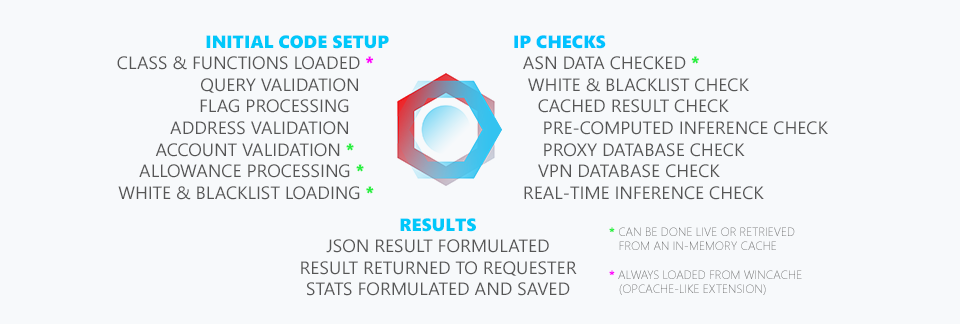
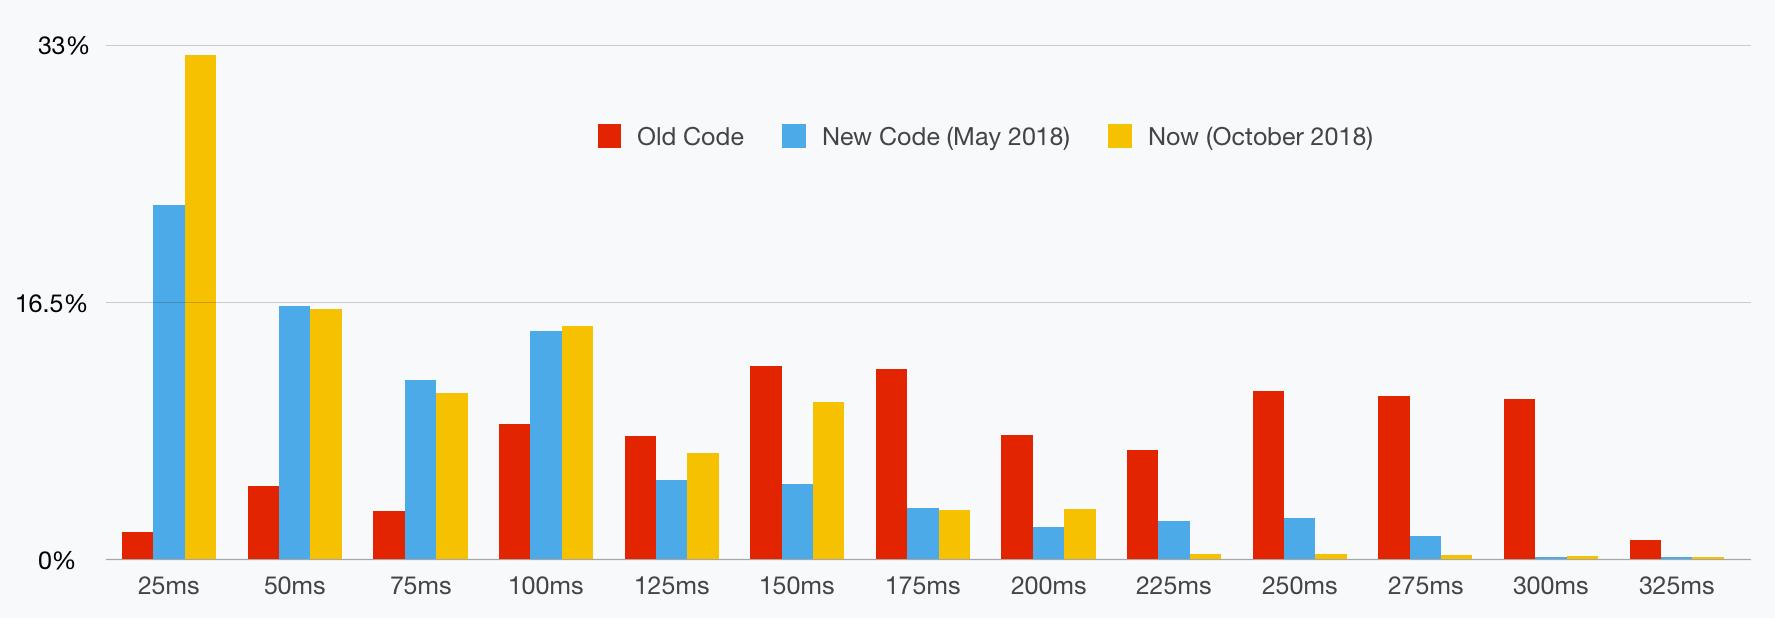
Above is an illustration of what happens inside our code. We've tried to outlay each step in the program loop. All of this usually happens at or under 7ms for every "full" query (meaning all flags enabled). And in the case of performing a multi-query a lot of what happens on the left is only done once. This allows the latency per IP checked to go down dramatically when you check multiple addresses in a single query.
We will elaborate on the caching system and machine learning below.
We talked a bit above about our custom memcache system. You may be thinking why did we roll our own when we could have used memcached or redis? - Both quite common and well developed. Well we found that in the case of memcached its use of UDP as a mechanism to withdraw cached data wasn't consistent enough under high load scenarios.
So to explain what behaviour we saw, most of the test queries we performed would be answered in under 1ms with memcached. But sometimes we would have queries that took 1 second or even 2.5 seconds. We determined this was caused by its network communication system.
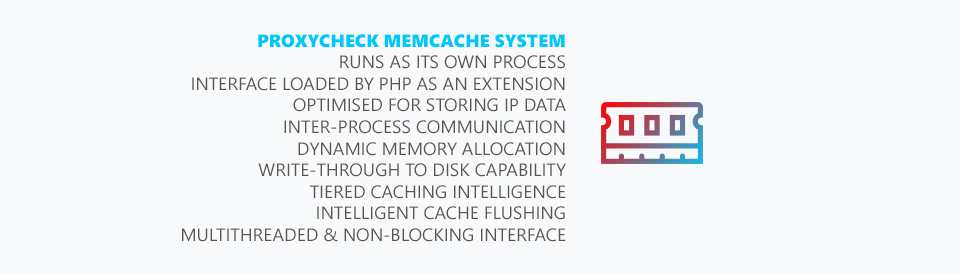
For a website those kinds of one-off latency hiccups are fine but for our usage those issues would add-up fast. After testing with it for more than a month we decided to roll our own system which relies on inter-process communication similar to an RPC call. Essentially we load an interface within PHP as an extension and that allows us to store and retrieve data as needed from our custom memcache process that runs separately on each server node.
Our memcache system also has some features you'll find in redis such as being able to write out cached data to persistent storage, network updates to keep multiple instances on different servers consistent and the ability to store almost any kind of data including strings, arrays, objects and streams.
In addition to those features it can also make use of tiered storage which means it can store the most frequently touched objects in memory and keep less frequently used objects on an SSD and then even even less frequently used objects on a hard disk. We've found this approach very beneficial for our large machine learning datasets where we try to pre-process as much information as possible so that query times remain low when utilising our real-time inference engine.
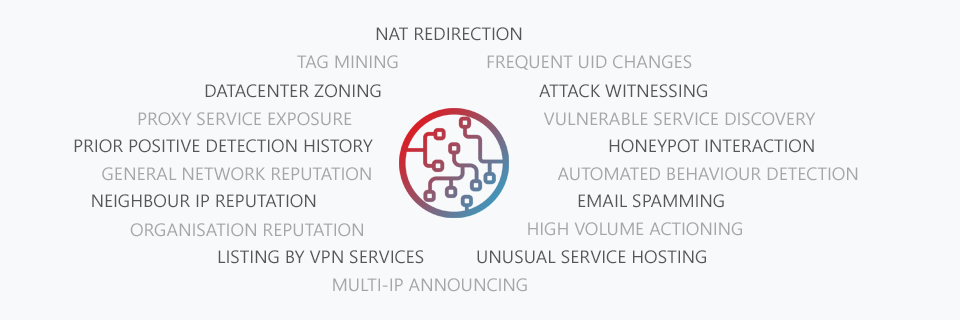
Which is a great segway into how our machine learning system works. We don't want to go into too much detail about what specific machine learning framework we're using or what models we're using but we can confirm we're using an open-source library. Above are some of the intelligence gathering methods our inference engine uses in determining whether an IP is operating as a proxy or not.
And we do want to elaborate on some of these as it may not be so obvious. For example "High Volume Actioning" due to our wide visibility over many different customer properties where they make use of our API combined with our own honeypots we're able to monitor unusual and high volume actions by singular IP Addresses, this could be signing up for many different websites, posting a lot of comments on forums and blogs, clicking on a lot of ads etc - Behaviours that are on their own not unusual but when done at a high frequency within a short time frame become suspicious.
Another we wanted to elaborate on is "Vulnerable Service Discovery". A growing number of Internet of Things (IoT) devices are being turned into proxies by criminals. These range from CCTV Cameras to Routers to general "smart" devices like home automation hubs, kitchen appliances and so on.
Our system during its probing and prodding of addresses discovers a great deal of compromised devices which either can be accessed by default credentials or have a vulnerability in their firmware which has yet to be patched that can allow an attacker to setup proxy serving software on the device.
Simply having a vulnerable device available isn't going to get an IP flagged as a proxy server but it does hurt that IP's reputation and it will be weighted along with the other data we have for that IP Address when the inference engine makes its final decision.
Finally we wanted to talk about "Automated Behaviour Detection" similar to the High Volume Actioning this is where we use our wide visibility and honeypot network to observe addresses performing web crawling, spamming, automated signups, captcha solving and other activity that fits botting behaviour. As bots have become more sophisticated and actually execute javascript within headless browsers it has become harder to stop them from accessing your web properties.
So detecting this kind of automated behaviour is extremely important and our model is designed to detect all kinds of automated behaviour through wide observation of incoming queries (combined with tag mining from our customer queries) and through our own honeypot network of fake websites, blogs, forums and more.
So we hope that you enjoyed this deep dive into our software stack. Obviously some parts we've had to hold a little close to our chest as we feel they give us a competitive edge (especially with regards to our machine learning) but we think we shared enough to give you some insight into what we're doing and how.
Thanks for reading and have a great week!
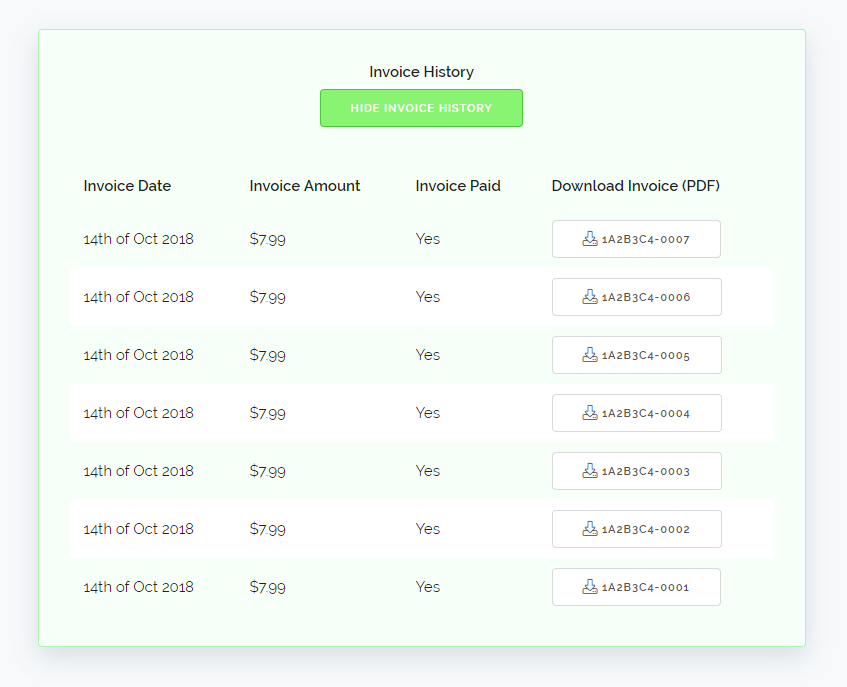 We will be showing your most recent 100 invoices here, due to that possibly becoming quite a long list we've also added a hide button. To keep the page loading quickly we are loading in the invoice log after the page itself is loaded so the dashboard won't be slowed down at all by this new feature.