Summer Cleaning

We think the saying is spring cleaning but we're almost through summer now. Over the past two days you may have noticed the site has gone through a lot of changes, especially the dashboard.

We've altered the appearance of many forms, added icons to most buttons across the site, improved the wording and formatting of emails and upgraded our previous site icon pack from Font Awesome 4 to Font Awesome 5 Pro.

We absolutely love Font Awesome and their newest icon series is the best yet, we've upgraded to their paid icons this time around (previous packs never had a paid option) because the new pro exclusive thin line icons are simply awesome.

We hope you all like the changes. We've had these in our development pipeline for quite a while since we did our last site appearance update on June 4th infact.

Thanks for reading and we hope everyone has a great weekend, we ourselves are taking the weekend off but we'll be back working on things on Monday.


Increased multi-check query limits, upgraded Web Interface and improved detection rates.

Today we've made a modification that some of our largest customers have been asking for, the ability to check more than 1,000 IP Addresses in a single query. This has been the limit since the v2 API was officially launched just over 7 months ago.

So today we've increased the limit from 1,000 to 10,000. This 10x increase should make it much easier for you to process older data, especially when you do it by hand through our Web Interface, however you are not limited to our web interface page as you can still perform multi-checks through the v2 API endpoint like normal.

In our testing we've found that as the volume of addresses in a single query goes up the time to process each individual address goes down. When checking 10,000 addresses for example we are seeing a processing time of 1ms per address (with network overhead not included of course). This is with all our flag based checks and results enabled.

We see a further decrease in latency to 955,000 nanoseconds (That's 9/10ths of one millisecond or 0.9ms). Per address check when just performing a proxy check with the VPN and ASN checks turned off. These latencies are incredibly low and that is the reason we've enabled the ability to check 10,000 addresses, essentially you can perform just a proxy check on 10,000 addresses in just 9.5 seconds and a full check with Real-Time Inference, VPN, ASN, Port and Type in 10 seconds.

In addition to this change, we know copying results from our Web Interface page has been annoying especially when you're checking a lot of addresses. Scrolling forever to be able to highlite three rows of 10,000 addresses would take a very long time. So we've added convenient copy to clipboard buttons to the far left of each result bar. Below we've included a screenshot.

Image description

The last thing we wanted to discuss was our improved detection rates. Over the past week we've been working hard on improving our detection of VPN service providers and proxy servers. To that end we've added 78 new datacenters to our VPN database and improved our proxy detection rate by 0.5%. Although that detection rate may not seem like much when we're dealing with hundreds of millions of queries per day that kind of improvement can have a big impact.

We would also like to thank the customers that have been sending us information about the VPN companies and datacenter hosts we haven't been detecting, this information is invaluable as we continue to build our database and we really appreciate the time you've taken to inform us.

That's everything for todays update. We hope everyone had a great weekend.


Plugin page updated and new JAVA example framework

Today we've gone through our plugin page and updated the styling and also removed plugins which don't support our v2 API which we launched seven months ago.

Below is a screenshot showing the new design.

We are taking both our code examples page and plugin page very seriously as they are very important to the growth of our API which is why we've spruced up the appearance of both pages and are committed to showcasing your work there.

In addition to the plugin page update we've also added a new JAVA framework to our code examples page which was written by DefianceCoding who also authored Anti-Proxy one of the Minecraft plugins featured on our plugins page.

We're incredibly grateful for his JAVA framework and I'm sure it will help many developers to integrate proxycheck.io into their products and services. And of course it's utilising the latest v2 API so you can get all the latest features exposed by our API.

That's it for this update we hope you're all having a great summer.


Changes to query tagging and logging

Today we have made two significant changes to our positive detection log which appears in your dashboard and both changes pertain to the tagging feature.

If you're unaware, the tag feature allows you to supply a small piece of text with each query you make for your own reference. We then display those "tags" back to you with the query in your dashboard if the query was detected as a Proxy Server, VPN Server or was Blacklisted by your own supplied blacklists within your dashboard.

The first change we've made is if you now supply the value 0 for your tag (aka &tag=0 in the URL) we will not save this specific query to your positive detection log even if it's a Proxy, VPN or a Blacklisted address. So essentially you can now turn off the positive log on a query-by-query basis.

This has been a feature requested by users who want complete privacy. By enabling this feature the IP's you test would never be held on our servers for more than a few minutes and not committed to any kind of log.

The second change is if your tag is blank, meaning you don't supply the tag query at all, we will only log this entry to your positive detection log if your storage use for positive detections is under 10MB for the current month.

So what that second change means is, if you tag your queries with a piece of text nothing changes for you, we will always log and save those for you regardless of how much storage it uses. But if you don't supply a tag of any kind we will not save them if you're using over 10MB of our storage for your positive detection log within the current month.

We've made this second change because sometimes users come under huge proxy based attacks. For example 5 to 10 million positive detections in a 24 hour period on a single account is not unheard of for us. Storing all of those positive detections can be burdensome as they take up GB's of storage space.

These changes are live across both our v1 and v2 API endpoints and the API Documentation page has been updated to reflect these changes as-well.

Thanks for reading and we hope everyone is having a great week.


v2 API adoption rate update

In late April we gave you the first update containing our v2 API adoption rate. To recap back then which was four months after the launch of our v2 API the adoption rate was 46.37% amongst our registered users and 79.54% of all queries made were to the v2 API.

The disparity between registered users who were utilising the v2 API and the volume of queries being made is due to our largest customers who made the most queries being the first ones to adopt the v2 API.

It's now July and it has been a full 6 months since our v2 API launched and the adoption rate has continued to increase quite significantly. As of today 72% of our registered users are now using the v2 API exclusively for all of their queries and 92% of all queries made to the API today were to our v2 API endpoint.

This upgrade rate is considerably higher than we were expecting at this point in time. At first we thought perhaps it was just due to new users but we've actually seen significant numbers of our prior v1 users upgrading to v2 driven mostly by third party software authors releasing new versions of their plugins which utilise our v2 API by default.

At current trends we're expecting more than 90% of our registered users to be on v2 by the end of this year. Another significant development which we haven't shared yet is overall usage trends.

Since April we have seen the volume of daily queries we process increase by four times. And yes you read that correctly, from late April to July 1st meaning two full months (May and June) the volume of queries we process every day increased four fold.

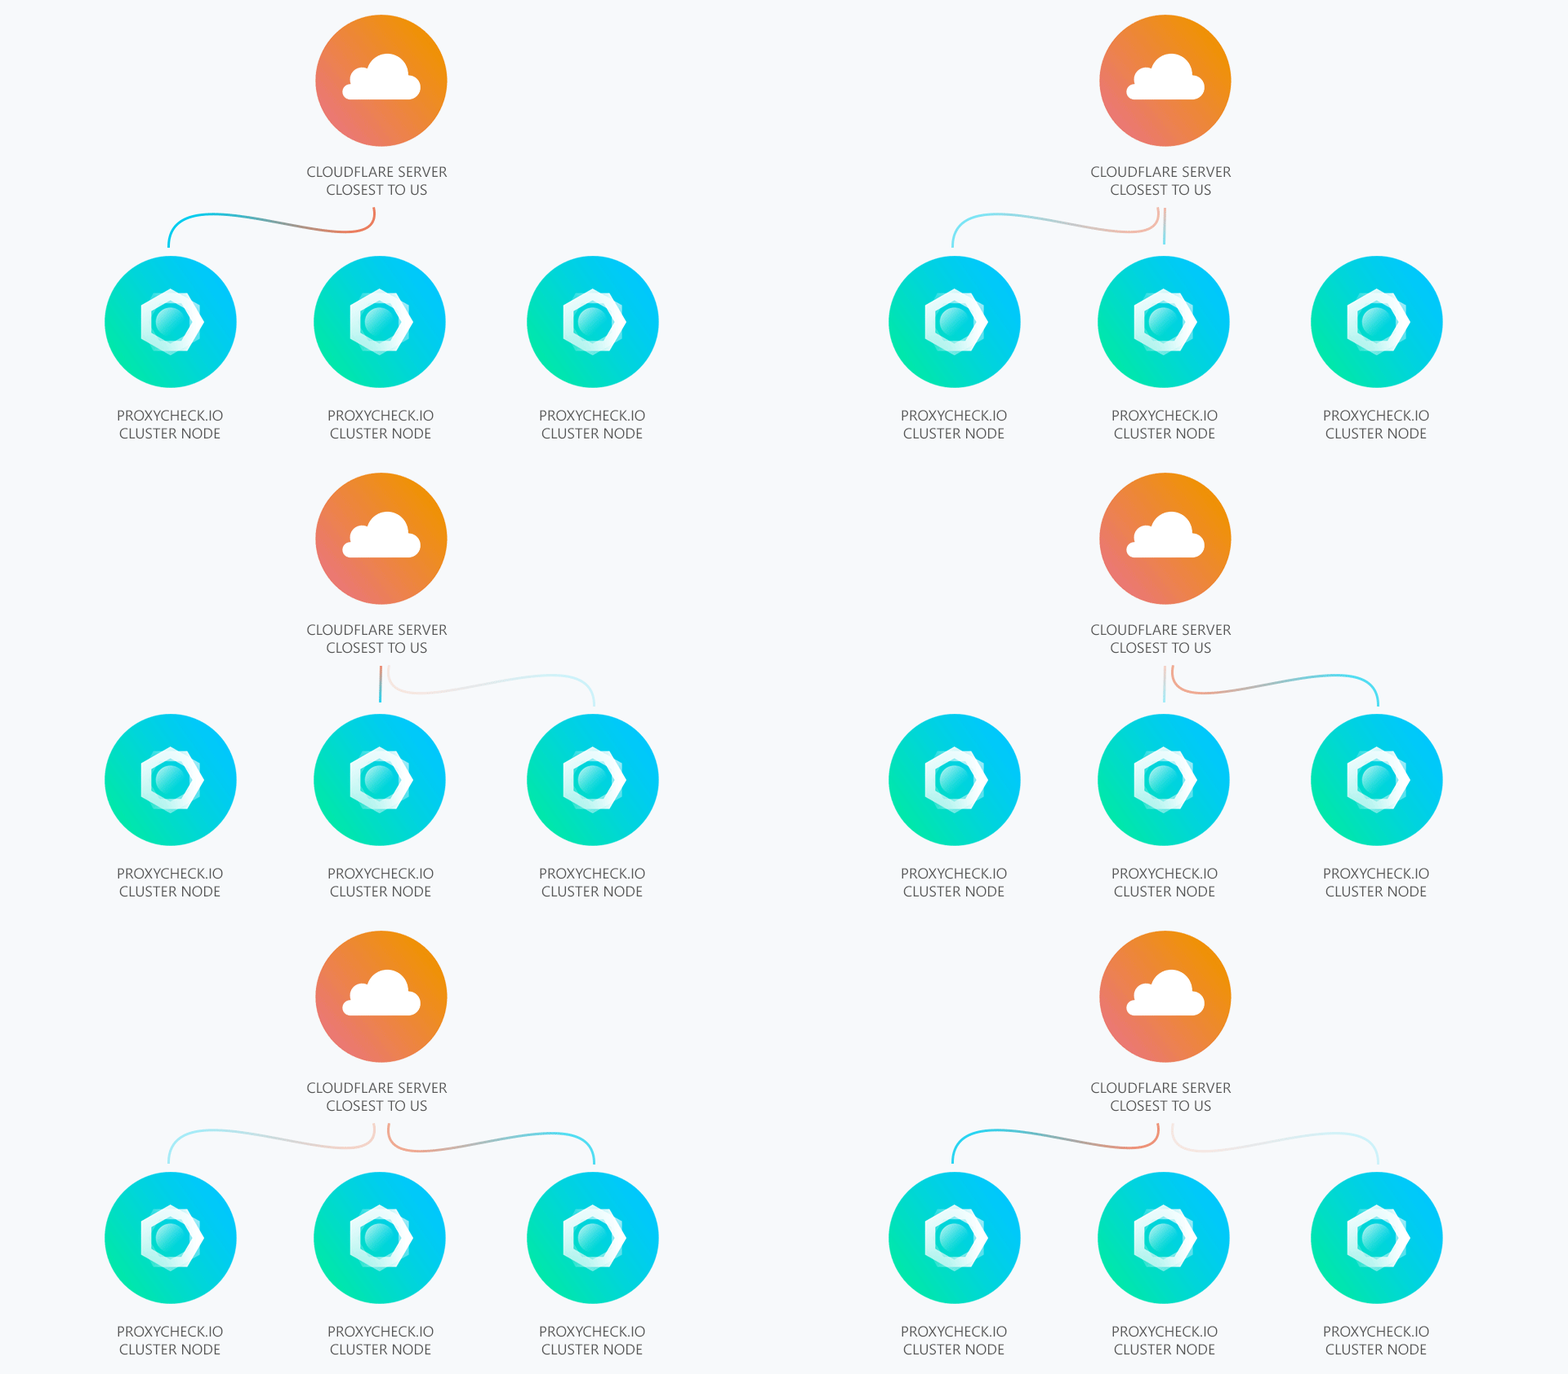
This isn't concerning as our infrastructure was designed to scale to these kinds of loads and in-fact our website and API are faster to respond now than ever before, including when compared to April. Through targeted code refactoring which focused on performance combined with configuration changes to our host systems (our cluster nodes) we've been able to absorb the extra traffic while delivering a better service overall.

We do not believe we need a forth node in the cluster yet, with all of the changes we've made that deal specifically with performance we believe we can comfortably serve around 2 billion queries per day before needing any extra servers and we have tested these kinds of load scenarios on the cluster to determine these numbers. Performance begins to degrade around 2.3 to 2.4 billion daily queries.

Whilst we don't publish exact numbers of how many queries we handle per day we can say it's between 100 Million and 400 Million daily queries. Every day we set a new record even if it's only by a couple million queries and mostly usage is predictable and steady allowing us to plan for future growth which includes sudden and dramatic usage spikes caused by some customers being under distributed attacks.

We hope this post was interesting, we couldn't be more happy with the adoption rate of our v2 API and also overall usage. We continue to believe we're offering the best bang for your buck and the numbers keep reaffirming that belief.


General Enhancements

Over this past month we've been focusing our efforts on enhancing various features and we'd like to share with you a few of those changes.

Firstly, the stats tab in the dashboard has had its backend significantly changed so that it can support customers with very large positive detections. It's becoming common for our largest customers to have several million positive detections made per day and we found there was a performance bottleneck that could take them a very long time to display within the stats tab, we have now resolved this problem.

So if you have quite a lot of positive detections you'll now find the log and country display on the stats tab both load much faster than before and all of your data is still available. These speed improvements also extend to the JSON export feature.

Secondly, we've updated our API documentation page with a new section which contains an array of all the possible countries you could receive in a response from our API when using the ASN flag. This has been requested quite often by customers through our support channels and so we thought it was prudent to include it on the API documentation page.

The last thing we wanted to mention is customer feedback for our new "last update" feature that appears on most of our webpages. We launched it at the start of this month and so far all the feedback we've received has been highly positive, customers really like the ability to see what changed especially on policy pages like our Privacy Policy and GDPR pages.

Thanks for reading and we hope everyone has a great week, we will be sharing some v2 upgrade statistics with you in our next blog post in early July.


New PHP library now available in Composer

Today we launched a brand new PHP Library which includes full v2 API support, all our features, query flags, custom query tagging and local country blocking support.

The best part, it's available within Composer which is the defacto dependency manager for PHP. You can find all the information about the package, how to install and use it over at its page on packagist.org here.

If you find any bugs please feel free to raise an issue on our GitHub page. We also welcome you to fork it, modify it and push changes which we will be more than happy to merge.

We hope everyone is having a great weekend!


Improved Last Update feature and backend changes

Last Update Improvements

You may have noticed that in 2017 we added a "Last Update:" feature to the bottom right of most web pages. When you hovered over it with your mouse a window would open displaying four or five recent changes to that page.

This is an important feature to us because it informs you of recent changes and it lets you know things are still being regularly updated. And it's not just great for seeing feature changes as we also use it on both our Privacy Policy and GDPR pages where we keep a record of policy changes.

Today we've updated the feature with a nicer appearance but most importantly we've made it better to see on smaller screens and added scrolling so we no longer need to restrict how many entries we place in the window. We've actually gone back and added many updates to the feature that were removed previously due to size constraints. Image description Above is a screenshot showing the Dashboard's last update window which now displays 23 updates going back to October last year.

Backend Changes

Recently we've been focusing more on backend changes that aren't very visible to users. This includes a complete overhaul of our cluster management code. In-fact just this morning we went live with our new cluster control system which stops race conditions between different nodes. This improves the reliability of our dashboard API's and all other features that take input data from customers. Essentially it stops data collisions which are caused by two or more nodes receiving data at the same time that conflicts with each other.

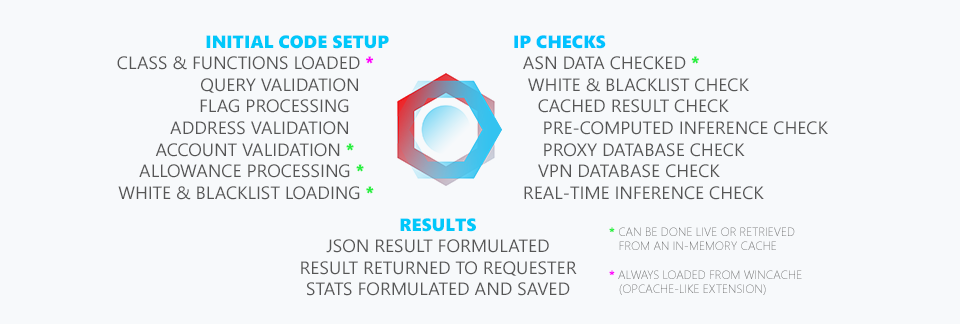
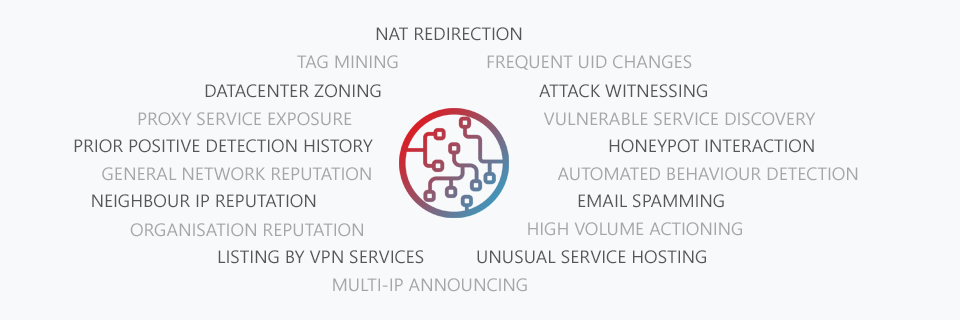
We also recently rewrote our proxy Inference Engine to gain higher accuracy and improved speed. This has been live since late may with impressive results.

Finally just a few days ago we completed a significant rewrite to our node syncing system with the goal of decreasing sync times and lowering CPU usage. We were able to reach both of those goals.

So that's everything we wanted to share with you today. We're committed to improving every facet of the service, not just the flashy things users can tangibly see and use but also the backend nitty-gritty which ensures the service stays fast and reliable for years to come.

Thanks for reading and we hope everyone is having a great week.


Dashboard and Web Interface enhancements

If you've been using the dashboard recently you may have noticed a few enhancements we've made to it. Including new preference toggles, new API setting options, enhanced whitelist-blacklist displays, a copy API key button and a new action result status indicator along the bottom of the screen.

We've made these changes to make the dashboard both look nicer and present to you more information so you know when a change you've made has been performed successfully.

Below is a screenshot showing the new preference toggles which replace our old tick-boxes.

The new toggles aren't just a visual improvement as you may notice we removed the "Save Preferences" button which means we now save your preferences as soon as you alter one of the toggles.

Below is a screenshot showing our new API Settings pane which is completely new.

The reason we added the first "Main API" toggle is because sometimes users get themselves locked out of their own website due to a misconfiguration of their client-side proxy checker code and this is simply a fast way to deny all checks made with your API Key so you can regain access to your property. This was added based on user feedback.

The second toggle is for security. Sometimes you may use your API Key in a less than secure place or implementation, for example in shipping software to your customers (which we do not recommend). But if you do want to use your key that way we don't want to stop you and so we've added this toggle so you can deactivate external dashboard access through our dashboard API's. What this means is, people cannot alter your white/black lists or view your account usage statistics by only knowing your API Key.

We've also added these new toggles to our refresh of the Web Interface page where we've changed the layout, moved the options to the far right and added a few more toggles for last-seen date and proxy type. As seen in the screenshot below.

Below is a screenshot showing our new Whitelist/Blacklist UI within the dashboard.

With the enhanced White/Blacklist UI you now receive three boxes along the top which display exactly how many IP Addresses, Ranges and ASN's were lifted from the text field below them. This is a great way for you to see if any entry you just added hasn't been detected.

Below is a screenshot showing our new action result status indicator.

You'll receive an indication like this whenever you change a preference, setting or whitelist/blacklist. And these indicators are not just visual, the blue successful indicator only appears if the request was actually performed successfully. You'll receive a red indicator like below if something went wrong.

To see all of these changes and some other subtle ones like the new help indicator icons and API copy button head on over to the customer dashboard. As always these changes are available to all customers whether you're on a free or paid plan.


Improved Email Preferences

Today in the customer dashboard we released an update that changes the wording in our email preference hover descriptions and we've included a new preference checkbox to enable near-immediate query exhausted emails which has been an often requested feature from customers. Below is a screenshot showing one of the new detailed hover descriptions.

Image description

We feel these new notices will do a better job of informing you about exactly the kinds of emails we will be sending and how often. By default the only emails we send you when you setup a new account are the ones displayed in the above hover description.

All our other email types including promotions, new features, daily query overages, total outages and changes are optional and opt-in only meaning you have to specifically enable them within your dashboard.

Thanks for reading and we hope everyone is having a great weekend.


Back