Our 2023 Retrospective

Image description

At the end of each year, we like to look back and discuss some of the significant changes that happened to our service and this year we focused heavily on our physical infrastructure.

We started early on April 14th by introducing QUASAR and PULSAR, which are our first South Asian server nodes.

These servers were very important because until this time all the traffic that originated in Asia was being served by our European infrastructure which introduced higher-than-desired latency. We had trialled many different servers from many different hosting providers and datacenters until we settled on these and over the past 8 months they've worked diligently.

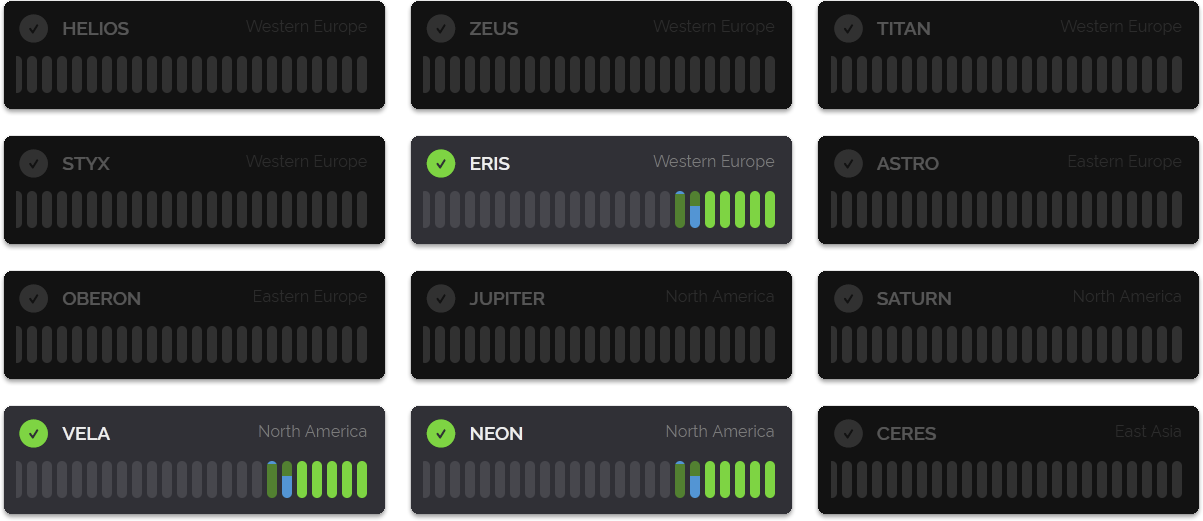
We followed this up just four days later on April 18th with the first major refresh of our American infrastructure. We swapped out our LETO node for LUNAR. This increased performance and set a new benchmark for our servers in the North American region going forward.

Then eight days after that on April 26th we introduced both SATURN and JUPITER as new North American nodes. This time we didn't replace any current nodes for that region as we had long-term leases on our other older servers so we kept CRONUS, METIS and NYX until between July and September, all of those older servers are now retired.

These three new North American nodes increased our performance so much that we reduced our footprint from four servers to three while more than quadrupling our per-second request capacity.

And with that final hardware update, we were now running the latest and fastest hardware in all regions and that gave us the confidence to increase our query limits from 125 requests per second to 200 requests per second per node and per customer in all regions.

Of course, other changes happened in supporting of our physical architecture, we re-designed the way our servers share and correlate database updates which made features like our new stats graph with per-minute resolution possible. We made some blog posts about both of those things, we also were able to lower our average query latency which gave us an extra buffer to introduce more data to the API like currencies and more detailed and accurate location data.

As we close out the year, the main thing that happened this year that makes me personally happy is our South Asian server nodes. It's no secret if you have followed the blog for the past several years that we have been trying to get servers in Asia that had the network connectivity we needed, the processing power we required and a price that made sense. So being able to finally reach that goal with hardware that will last us many years was a great achievement.

I also want to give one shout-out to the power user improvements we made this year, not only the new high-resolution stats graph already mentioned above but also making Custom Rules and Custom Lists fully searchable. Such a simple concept but it works so well and saves so much time, especially for our most heavy users who have a lot of content in their dashboards.

Thank you to everyone who uses our services for a wonderful 2023, we're looking forward to what 2024 brings!


Operators added to the Positive Detection Log

Image description

In December 2021 we added a feature to our threat pages and API called operator data which lets you view specific information about VPN operators including their name, website and certain policies of their service.

This has been a great value add for our users especially as all that data is exposed through our API directly. However, there has been one area where we've not exploited this data until today which has been the customer Dashboard.

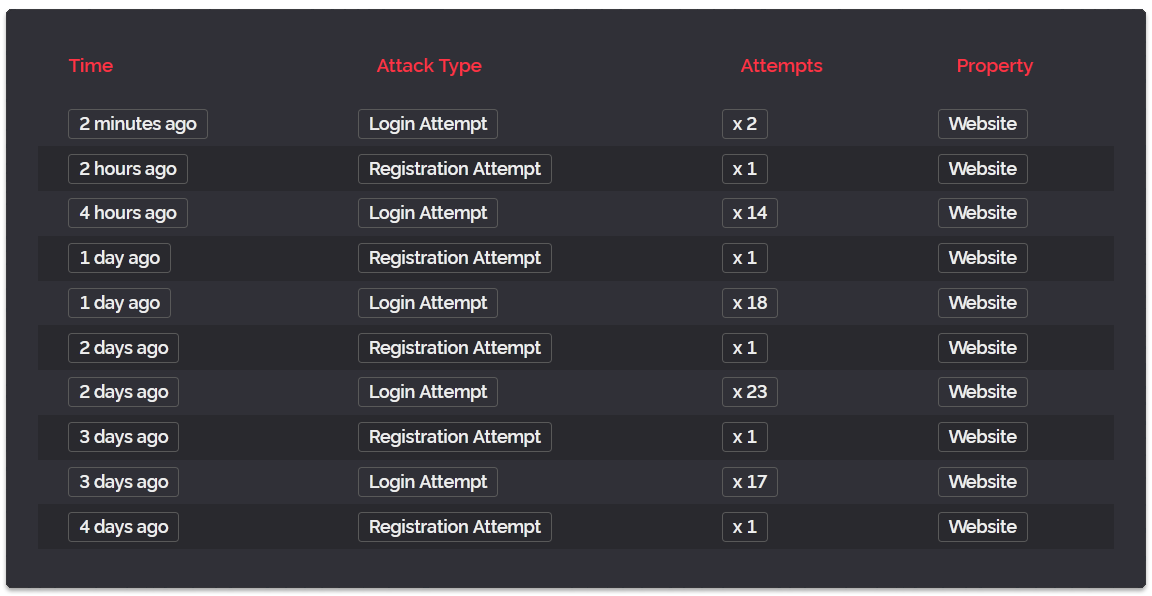
Previously you would only see entries in your positive detection log within the Dashboard like below.

Image description

As you can see the entries are quite generic, a VPN was detected but you don't know which operator it's from and you may want to know that especially if you see a pattern of abuse from a specific operator's services.

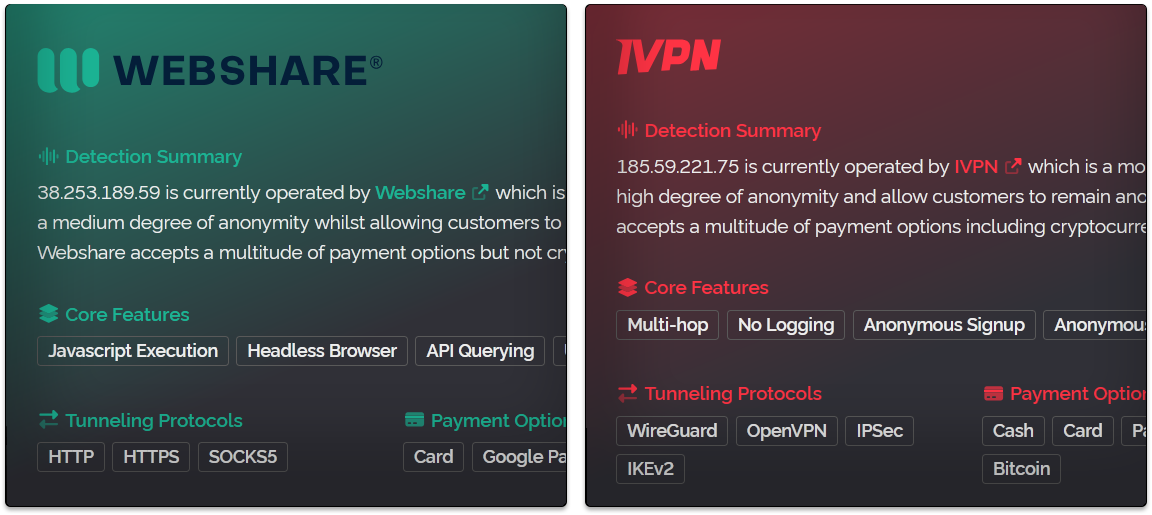
And so from today, you'll now receive a more detailed response like below when we know who is operating a VPN server.

Image description

We've made these tags clickable which will open the operator's website in a new tab/window of your browser making it easier for you to research them.

We also tied these new tags directly into our pre-existing operator database (making sure they're always up to date) where not just the names and URLs are lifted from but also the color coding which matches the VPN operator brand colors for easier visual recognition.

So that's the update for today thanks for reading and have a wonderful month!


Improving support for decentralized VPN networks

Image description

As the commercial VPN market reaches maturity and the majority of VPN providers have a well-understood and traceable infrastructure we're starting to see novel approaches to building and maintaining VPN server fleets that thwart traditional detection methods.

One of these approaches is known as a decentralized VPN or dVPN for short. These are where a VPN company doesn't own and operate the VPN servers they sell access to and instead, they act as a broker between consumers seeking to use a VPN and "node operators" who make available their internet connections for rent.

For the vast majority of these dVPN services their decentralized infrastructure can still be discovered and added to our database like any other VPN service but some of them have made it more difficult. One such service we're focusing on today is MysteriumVPN which has a complex broker system utilising tokenized addresses to mask node operators.

To be more specific, in MysteriumVPN's case, you cannot glean the IP addresses of their VPN nodes until you pay some cryptocurrency called Myst to one of Mysterium's brokers who then connects you to a single node operator. Essentially this means you have to pay every individual node operator a small amount of cryptocurrency to be given their node's IP address by the Mysterium broker.

This unique approach has meant that for some time now Mysterium nodes have gone undetected and their abuse on the internet has reached critical levels. Everything from bypassing streaming site geoblocking to scraping website content and performing fraudulent transactions with stolen payment information has been facilitated by these nodes.

Because of that, we've taken a special interest in dVPN's and throughout July we've been developing new tools to better handle them. That is where today comes in where we wanted to share our work on dVPNs and specifically share with you about Mysterium due to it being the largest in the space.

Image description

Above is what the new Mysterium operator card looks like, you'll find addresses from this VPN service presented via our API with a heightened risk score beginning at 73%. This elevated risk score reflects the danger we perceive these addresses as posing because not only is Mysterium a fully anonymous service but due to the difficulty in discovering the addresses, the lack of detection of them by services like our own and most of the addresses being hosted from residential address ranges it has become a magnet for criminals.

At present, we're indexing a few thousand nodes per day and expect to have 95% of the nodes offered by the top 10 dVPN providers detected by the end of this month. We would also like to take this opportunity to thank customers over the previous several months who provided IP addresses that they were certain belonged to proxy or VPN networks, we were able to match many of these to dVPN operators and thus expand our detection capability.

Thanks for reading and have a wonderful weekend!


Improvements to the Dashboard for Power Users

Image description

Today we've introduced several new features to the Dashboard to make it easier to manage your Custom Rules and Custom Lists, especially if you have a great many of them as some of our customers do.

Firstly we've reduced the space between entries so more can be viewed at once in a vertical stack. This is a minor change but beneficial all the same. You can see how this looks in the screenshot below.

Image description

Secondly to that, we've added a new button to the top of your rules and lists which will insert a new entry at the top as opposed to the bottom of your stack. So you can now add new entries without needing to scroll to the bottom of your stack only to need to drag the rule to the top again.

Thirdly, we've added a new button which will hide any disabled rule or list that you have. We know many of our users like to create situational rules or lists and leave them disabled until they're needed, as a result, you may have many cluttering up your rule or list interface. This feature was requested by a customer only yesterday and we were happy to include it in today's power user update.

The fourth and final feature is a filter field which lets you search for your rules and lists based not only on their names but also their content. So if you've created a rule that targets a specific country or a list that contains a specific address you will no longer need to closely examine every rule or list in your dashboard to find them, you can simply search for it by the piece of information you know is within them. Below is an example of us filtering for a specific rule based on the ISP Vodafone that was included in the rule.

Image description

All of today's new power user features utilise client-side Javascript exclusively which means not only do they work live without page refreshes but they're incredibly fast and smooth with animations where appropriate to convey that something has been hidden and not deleted etc

We hope you enjoy today's update, thanks for reading and have a great week!


Performance Regression Discovered & Fixed

Image description

This is a brief post to let you know that between the 6th and 15th of June, there was an intermittent performance regression affecting our North American service area.

This was caused by a regression in our code that significantly increased database queue times when the API was under high load conditions. We were first made aware of the problem on the 8th of June by a customer but when we investigated, the high load conditions had already ceased making it difficult to replicate and diagnose the cause of the problem.

Today though we were able to view the performance regression live as it occurred and that enabled us to properly diagnose and resolve the code issue. As of this post, everything is solved and the API is once again answering all queries with a consistently low latency. We would like to thank the customers who messaged us about the problem, we would not have discovered it so quickly without your assistance :)

Thanks for reading and have a wonderful week!


Location data improvements

Image description

Today we have released a large update to our location data which not only improves the accuracy and precision of all our location data but adds data for IP addresses that lacked any previously.

This includes region, city and postcode data. We've been working on this for a while and anyone using our development branch, you may have noticed some addresses were giving different and more complete location data compared to our stable releases until this morning.

Image description

We wanted to make the new data available to as many of our users as possible so we have gone back and ported the new code to every version of the v2 API starting from August 2020. If you're on a release before that you will need to change your selected API version from within the customer dashboard.

With this update, we've also rewritten how the metadata for IP addresses are both stored and accessed and in doing so we were able to eliminate one extra database read operation which should improve API performance, if only slightly.

So that's the update we have for you today, thanks for reading and have a wonderful week!


Re-architecting Software The Right way

Image description

In computing, there is a strong resistance to complete rewrites and there are many great reasons for that including cost, time, the potential for new bugs and regressions in functionality.

Instead, the software industry prefers to do what we call refactoring where you take existing code and improve it by making many small changes over a long period so that each change can be more easily implemented and the results of those changes measured in a controlled manner. In short, it's fast, it's cheap, it gets results and it lowers the potential for problems.

But now and then it may be required to completely rearchitect a system and there can be many reasons. You need more performance, you need the code to scale better to more computing resources, new hardware has arrived that runs the old code poorly or not at all, new libraries, operating systems or execution environments are incompatible with your old code etc

And so many of the above conditions can precipitate a rewrite.

Image description

This is exactly where we found ourselves this year with some of our backend software written since 2017. This was software that was designed for a specific operating system (Windows Server) which meant we had leveraged some Microsoft-specific operating system functions which made our code incompatible with Linux.

We had also designed this software around certain hardware that we had access to at the time which meant low core count processors and slow storage using hard disk drives. This resulted in a lot of our backend systems being conservative in how they used the hardware, meaning mostly single-threaded operations and serial data access.

Our current servers average 23.5 CPU threads whereas when most of the code we're discussing was created our biggest and best server only had 8 CPU threads. And when it comes to storage we used to use HDDs that could manage only 800 IOP's now we're dealing with NVMe SSDs that can handle 1.2 Million IOP's.

With us wanting to rewrite things to be processor-independent and operating system agnostic whilst taking better advantage of our latest (and future) hardware it necessitated some rewrites. For sure we could refactor some of our old code and in many smaller cases that is what we did but for the biggest stuff rewrites were the right way to go.

So how do you re-architecture your software the right way?

Firstly you need to do a full code review for the system you're going to rewrite. This includes reading all of the code and understanding and documenting all the tasks the code performs and why it does them. This is paramount because otherwise, you will forget to include functionality in the new rewrite that the previous iteration contained.

Secondly, you want to identify all the deficient parts of the code that you want to improve upon. This could be simply messy or unmanageable code or it could be just unproductive code that performs poorly or doesn't meet your goals for now or the future (such as tying you to a particular operating system).

Thirdly you want to plan how you intend to improve the code to meet the goals you have for the new program. For us that mostly entailed making things multithreaded, better use of our storage system's I/O capabilities, not using any Windows operating system-specific features or functions that won't be available on Linux. And of course, the culmination of all this work is added scalability and flexibility.

Fourth and finally you write and test the code. We did a lot of testing during development to test our many hypotheses and this informed our design process. As we learned the capability of certain approaches to problems the decisions we were making changed along the way.

So let us go over some of these.

1: About two years ago Microsoft ended support for WinCache which was an in-memory data store for PHP. We made extensive use of this and so we had to build a replacement. Thus two years ago we wrote what we call ramcache. It performed the same role and re-implemented all of the WinCache functions. We were also able to extend the functionality. WinCache had a 85MB memory limit, we have no such limit in our ramcache as one example. We also made it operating system agnostic aka it will run on anything including Linux.

2: Webhooks. We use a lot of webhooks, mainly for payment-related events such as sending you an email when a payment is declined or coming up but we also use webhooks for what we consider time-critical events such as when you make a change in your Dashboard that must be propagated to all cluster nodes very quickly.

3: Our database synchronisation system. At one time the processor usage caused by synchronising our databases was as high as 70%. This did scale back as a percentage when we upgraded to systems with faster processors but it was still very high and we saw the usage steadily increasing as our customers generated more data per minute. In this case, we developed a new process called Dispatcher to handle this traffic and we dramatically reduced processor usage to just 0.1%.

4: Cluster management, node health monitoring & node deployment. Before our rewrite, this heavily relied on Microsoft-specific operating system features, especially the node health monitoring and node deployment features. We've now rewritten all of these to also be operating system agnostic and processor independent.

So let's look at some net results. Previously our webhooks (where one server specifically sends out a small update to one or more servers in the cluster) took an average of 6 seconds for a full cluster-wide update. The new code which is multithreaded when it comes to network usage has reduced this time to just 0.3 seconds. That's a 20x performance improvement.

Image description

When it comes to Dispatcher, this was a ginormous change for us as everything that keeps our servers in sync with one another utilised our previous system. The old system was so encompassing it didn't even have a name because it wasn't thought of as one specific object, the code was interspersed with so many other functions and features that it was almost omnipresent throughout our code.

This has all changed with Dispatcher which provides a standardised interface for reading and writing to our databases and it provides a framework for our cluster nodes to provide data in the most passive (and thus least resource-intensive) way possible through the use of packaging up node updates and having a singular chosen master node for each geographical region temporarily selected as a collector, processor and distributor of database updates.

You can think of Dispatcher a lot like a train network. Each node operates its own train that is constantly going around the track to all the other nodes and picking up data. Master nodes pick up data from non-Masters, they process the data and then carefully decide where in the database that data should be inserted. It is then repackaged by the Master and presented to any trains that come by from non-Masters which pick up those updates.

Image description

Every few minutes the nodes hold a vote and the node with the most free resources and best uptime is chosen to act as the master for that geographical region. The way we stop conflicts from having multiple master nodes able to distribute updates simultaneously is by having clearly defined containers, merge conflict resolution and a database that is built around a structured 1-minute time table.

Each minute in the real world is accounted for in the database with a master node attached to it for that specific minute and geographical region. That node and only that node can perform maintenance and alterations unless the nodes agree to remove it from that minute and assign another node, thus allowing another node to become the master over that minute. Any node can read from a minute but only masters can perform alterations and writes.

What all this results in is a high-performance database synchronisation system that scales to however many server nodes we have and most importantly with the least amount of processor and storage burden.

While performing all these code rewrites and refactors we also investigated new technologies and tuned our execution environments for the code we author. To that end, we upgraded to the latest PHP v8.2.6 across our entire service including all our webpages. During this upgrade process, we also engaged the latest JIT compiler present since PHP v8 as we saw massive improvements in page load times across the site with no regressions.

So that's the update for today, we hope you enjoyed this look at what we've been up to and the illustrations.

Thanks for reading and have a wonderful week.


Weekend Topic: Why we use a monolithic architecture

Image description

For this blog post, we would like to go over our architecture design for proxycheck.io and explain some of the decisions we've made along the way in building the service. To start with what exactly is a monolithic architecture and what is the alternative approach?

Monolithic in software pretty much means running all your services on one or more beefy servers as opposed to breaking out your services into what is commonly referred to as microservices and having them distributed across many smaller servers or even running them on what is known as "serverless" or "edge" computing infrastructure. The idea behind the microservices approach is you remove a lot of overhead like managing an operating system, you only instead manage the specific application that you've developed.

The other benefit is you can scale up microservices horizontally meaning if you need more resources for an application you can simply spin up another copy of the microservice on another system and load balance between them.

This approach however does have some caveats. As the amount of microservices you have increases the volume of network activity between all the services in your infrastructure increases. After all each service needs to obtain, process and share data with the rest of your infrastructure and the more servers you have sharing that burden the more there is to keep synchronised.

Database traffic is often overlooked when people turn to these services but it can become substantial to the point that you cannot expand horizontally anymore because there aren't enough resources to keep all your services synchronised. In addition to this complexity, there is also a creeping increase in cost from all this overhead which can overshadow the initial costs you thought you would incur for the resources you're using to serve customers.

Some good examples of how other services moved from microservices to monolithic would be Dropbox or even Prime Video which recently shared an interesting blog post about how they reduced their costs by 90% when moving from microservices to a monolithic architecture. And yes that is Amazons Prime Video who were using Amazon's AWS services to operate their microservices.

To quote Amazons Prime Video:

"Moving our service to a monolith reduced our infrastructure cost by over 90%. It also increased our scaling capabilities. Today, we’re able to handle thousands of streams and we still have capacity to scale the service even further."

So not only did it save them money but it also increased their ability to scale and helped them to support more users with fewer servers.

We have used a monolithic architecture since the very beginning because although we identified the benefits of microservices and specifically the use of AWS's EC2 and Azure clouds to scale rapidly we identified many drawbacks. Performance for these services on an individual level is not high that is to say individual requests have poor performance.

To put it another way, this microservices approach is akin to flying 2,000 hot air balloons instead of having 2 jumbo jets. Sure you can have double the amount of people across those hot air balloons but the time it takes to get to their destination will be much longer.

And that was and continues to be the crutch of the microservices model that has kept us not only on our monolithic trajectory but our bare metal one too. When we rent servers we are the only tenant and we get to pick the hardware, we often pick the fastest hardware available and we have been replacing our older servers with new ones that offer 3x to 4x their performance.

Meanwhile, if you look at the past 5 years of "serverless" computing like EC2 the performance has remained pretty much the same driven by the service provider's desire to maximise the amount of customers per unit of compute resource available.

To us, speed matters. If you compare for instance our customer dashboard to companies that use cloud providers and microservices you'll find ours loads instantly and populates with data in the blink of an eye while some of even the largest companies like OVHCloud have you sit for upwards of 10 seconds for their customer dashboards to populate with information.

Now we don't think that microservices have no use at all. There are certainly workloads that benefit from this approach especially data processing that needs a lot of workers and doesn't need instantaous results and any workload that can be accelerated by dedicated fixed-function silicon for example video transcoding, network encryption/decryption, packet routing. All of these tasks make sense for the horizontal growth approach that serverless/microservices can provide.

But for anything customer-facing where speed and latency are paramount, we just don't see the same benefits, users get frustrated waiting for things to load, the performance of the service isn't great overall, the costs can spiral out of control and the overhead with regards to data synchronisation can be crippling.

We hope this was interesting, we wanted to go a bit more in-depth about this topic due to our recent infrastructure posts which spurred some customers to message us and ask about why we don't use cloud providers and instead continue to use bare metal.

Thanks for reading and have a wonderful weekend.


New North American Nodes

Image description

This has been a month full of new servers and today is the last announcement we have regarding servers, we promise.

Over the past day, we brought online two new high-end servers within our North American service region called Jupiter and Saturn.

These are now the highest-performing servers we have serving that region and each of these servers are 6.27x more performative than our previous nodes excluding Lunar which was added last week and is itself very high-end.

To put the total performance upgrade in perspective our three new servers (Lunar, Jupiter and Saturn) provide us with 100,000 units of performance compared with 25,000 units of performance for our old servers (Leto, Cronus, Metis and Nyx). That's a straight 4x performance uplift while moving from four servers to three servers.

However, we will not be saying goodbye to Cronus, Metis or Nyx just quite yet because we have leases on those servers which expire between July and September. So until then, we've tweaked our load balancer to split the load so that Cronus, Metis and Nyx handle 25% of North American traffic while our three new servers Lunar, Jupiter and Saturn will carry the other 75%.

This upgrade is not just to give us breathing room to grow in the future but also to address some very large customers we picked up since the start of this year. We've seen our North American traffic go from around 35% of our daily mix (Europe being the rest) to 60% of our traffic. And with the new Asian servers we introduced earlier in the month we've seen our European load fall a bit due to some of the Asian traffic they would otherwise handle going to those new dedicated servers in the Asian region.

So in short, we needed to bolster our American infrastructure. And in addition to this change, we are also making changes to our per-second request limits. Before today you could make 100 requests per second to any server before receiving a warning and 125 requests per second before having your requests denied for up to 10 seconds.

Due to our new increased hardware performance, our planned reduction in the number of servers we have (while making each server more powerful) and also the very large customers we've been acquiring we've decided to increase the limits to 175 for the warning and 200 for the hard limit. The limiter still only looks at the previous 10 seconds of your request volume so you can still go over these limits if it's brief enough.

Essentially the true limit will be 2,000 requests over 10 seconds whether all those queries were made in a single second or spread out over the full 10-second period. This is up from the 1,250 limit we imposed previously. And remember this is per server. So for our North American servers when we only have 3 servers (down from the current 6) that limit will become 6,000 requests over 10 seconds instead of 3,750.

These new raised limits will also help with our new South Asia region where we only have two servers although the two combined are the equivalent of 8 of our last gen servers in performance and so they can handle these increased request limits with ease.

We know discussing infrastructure as we often do is not the norm. Most services like to shoulder these kinds of things and not share them publicly. We don't want to do that because we feel it's an interesting part of building any business and we want you to know that your paid subscriptions are being utilised to improve the infrastructure that ultimately delivers the service you're using. These new servers we've deployed aren't just going to increase the volume of traffic we can handle, they'll also lower the processing latency so everyone who uses our service will benefit from that too.

Thanks for reading and have a great week!


Introducing a new North American node

Image description

Today we have introduced a new server called LUNAR which is replacing our previous server LETO. This new server is three times more performative than any of our previous North American servers and it's physically identical to the new servers we've deployed in South Asia that we mentioned in our previous blog post.

We've been very pleased with the performance of those two new nodes and that's why we're moving forward with a North American server refresh based on the same hardware platform as those nodes.

As mentioned above we haven't merely added LUNAR to our current roster of servers, we've removed LETO and replaced it with LUNAR. We wanted to discuss why we did this in detail as we think it may be interesting to others building resilient web services like we are.

So firstly we should explain how LETO came to be and what platform it was based on. When we were seeking to add capacity to North America we had a self-imposed mandate to acquire a server with not just high performance but that was hosted by a different company to the one we were mainly using so that we could further diversify our infrastructure.

Similar to how we use three different geographically separated data centres in Europe we wanted the same in North America. Finding a server that was fast enough, affordable enough and hosted by a company we weren't already using was quite difficult.

And adding to the pressure was that we had traditionally shied away from using cloud hosts for a multitude of reasons including performance, cost and security. To put it in other words, we only used bare-metal servers where we're the only tenant on the machine.

As our search continued we did come across a cloud host in the USA that was offering the latest-generation of AMD EPYC-based virtual machines and the price was very attractive. We decided to test one out and found the performance was very good, in-fact we were seeing 2x the performance of our other North American bare metal servers for the same price.

So with performance, cost and diversification of our hosting all accomplished we decided to bring LETO online. It was to be our first virtualised server node. And for the first few months, everything was very good but then we ran into issues.

Firstly we suffered from random shutdowns. Since we're hosting a virtual machine on someone else's physical infrastructure from time to time they need to shut down the Hypervisor that runs the virtual machines to perform maintenance. Their maintenance windows never synchronised with our own and we never received advanced notice of when such maintenance would be occurring.

And so our LETO virtual machine would sometimes seemingly crash at random. Our systems take a while to shut down due to how much data they hold in memory which needs to be committed to disk and this 2-3 minute flushing period was too long for our virtual machine host.

Second to that and the most pressing issue for us was rapidly degrading performance. We're not going to name and shame the host we were using because we know this isn't a unique problem with their service. The broad issue with virtualised infrastructure is when you share a system with other people you're at the mercy of what they're doing with their slice of the available computer resources.

And when we first got our server it was clear we didn't have many "noisy neighbours" sharing the resources with us but over time as more tenants moved in their usage began to impact the performance of our virtual machine. Even as we scaled LETO up by doubling its resources (and pricing) we were still seeing untenable performance regressions.

And that brought us to this decision to end the LETO experiment and go back into bare metal infrastructure where the performance is always consistent and predictable as is the stability since we control the hardware fully and can choose when and how we perform maintenance.

As of right now we no longer have any virtualised infrastructure driving our core services, we're only using virtual machines for honeypots and other non-essential services.

Of course, we do think virtualisation has its place, we use it on our bare metal servers for local software development as one example. But for a service like ours that needs low latency, consistency and stability it's just not a good fit at this time.

Thanks for reading and we hope you're all having a wonderful week!


Back