![]()
Today we've expanded the information we expose through our API to include hostnames. This has been an often requested feature which we've been working towards delivering at scale for some time, the reason it has taken us so long is because of the unique challenges presented by hostname data, such as:
- Because IPs have unique hostnames we cannot share hostname data across a large range of addresses like other data.
- Performing hostname lookups live to DNS servers as you perform an API request has a huge latency penalty (sometimes 1 sec+).
- There are billions of addresses we need to cache the hostnames for and the data must be synchronised across all our servers.
So to deliver on this feature we had to think very carefully, solve a few technical hurdles and perform a lot of testing. Hurting the API's responsiveness was the biggest concern we had going into this as we knew the data would be very large and cause a lot of in-memory cache misses that would result in expensive database queries.
So how are we accomplishing hostnames at scale?
Firstly, to tackle the latency issue we're going to cache the hostnames for every IPv4 address and through some clever compression we've devised we're able to get our hostname database to a small size while also making it extremely efficient to read from and write to. As a result, in our testing there is no measurable impact on the latency of the API.
Secondly, we're not going to perform live lookups of the hostnames we don't have cached. This won't impact IPv4 lookups as we intend to cache 100% of them at all times but for IPv6 this represents a hurdle that we're still working on. The issue with IPv6 addresses is the IPv6 address pool is so large that we cannot pre-compute them.
One option we explored was compressing the IPv6 addresses into contiguous ranges but that leads to inaccuracies in the data and still leaves an unfathomably large amount of data to cache and synchronise. So for the time being IPv6 will have experimental support only which means if we do have a hostname available for an IPv6 address we'll present it but don't count on these being available.
So let's show you how it looks on a live API result, we've got two outputs in the screenshot below and we've highlighted only the new hostname data in both.
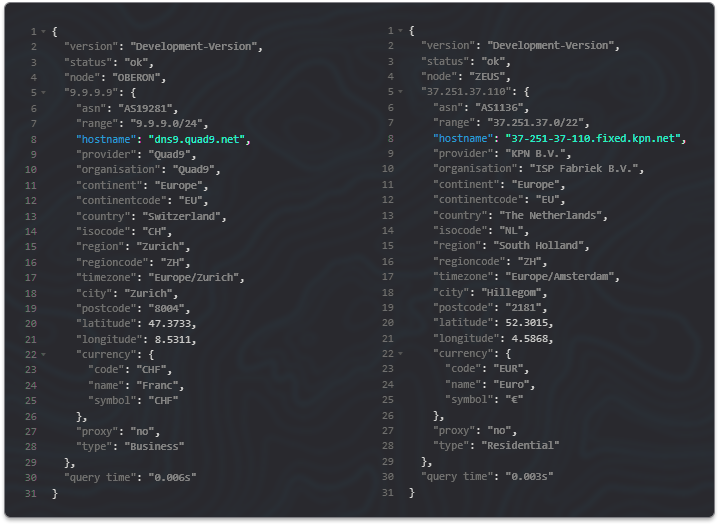
To have hostnames show you'll need to either supply &asn=1 with your requests or utilise a hostname as a condition in your custom rules. If we don't have a hostname for an IP address it simply won't show one in the API output just like with our other data.
So that's the update for today, we know a lot of you have been waiting for this feature, we've had many requests for it over the years and it has taken some considerable time to deliver this for you but today the wait is at least partially over, we're still working on broad IPv6 support for this feature and hopefully we'll have an update for you on that later this year.
Thanks for reading and have a great week.