Today we're launching a new major version of our API as an open beta. This new version radically alters the output format of our API, provides much more information and enhanced performance for our largest customers.
In addition to the new API we've also launched a new major version of the Dashboard which supports v2 and v3 customers together with enhanced graphs, new data export formatting, updated iconography and crucially for our paying customers a faster initial loading time that matches what free customers have been enjoying.
The new v3 API
So lets get started with the v3 API and what's different to the v2 API. If you just want to head to the documentation and read through all the details and check out the test console you can do that here. But for a quick overview here is what's different.
- We have a brand new output format that puts all the data within categories like network, location and detections.
- We've renamed some output keys so they make more sense, isocode is now country_code as an example.
- We no longer present obscure detection types, we present categories instead such as proxy, vpn, tor, scraper, hosting etc
- We've moved from yes/no responses to booleans meaning you wont have to do string conversions in your code anymore.
- Almost all query flags such as vpn=1 and asn=1 have been retired, you'll now receive a full result by default.
- We're responding with official HTTP response codes for denied and refused queries, no longer will every response just be 200 OK.
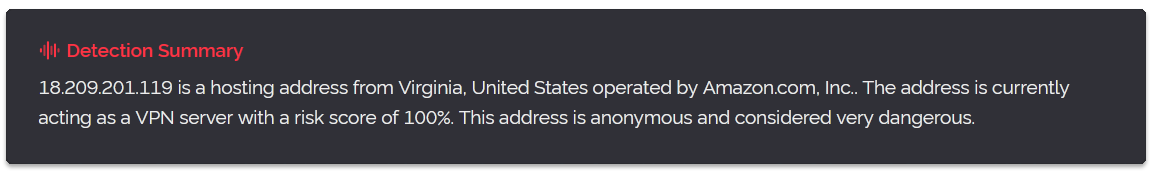
Below is a screen capture featuring an IP check performed on our v2 API on the left and the new v3 API on the right.
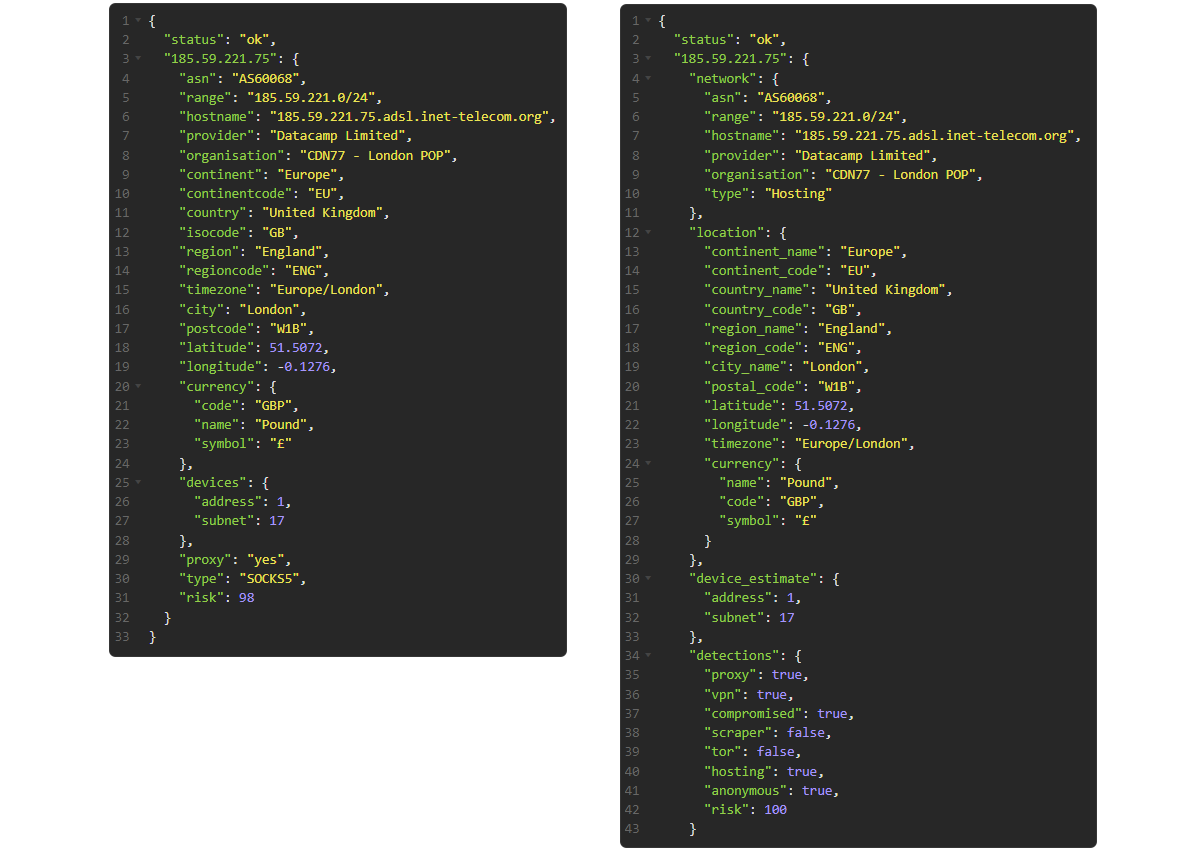
As you can see, a lot of the same information from the v2 result is still featured in the v3 one, although in different sections and with renamed keys. However there are some differences, the v3 API now lists the network type as its own definition in the networking section and there is a new detections section featuring many true/false statements about what the IP is doing.
In-fact we cut out a large portion of the v3 result for brevity as it's detecting a specific VPN provider in this result while the v2 result omits this completely because the proxy result (SOCKS5) has overwritten the VPN result, something the v3 API doesn't do.
The main thing to pay attention to if you've been using proxy: yes from the v2 API format to determine if a user should be denied access, instead use anonymous: true from within the detections category section of the v3 API result.
One last thing to mention about the v3 API specifically, it costs the same as the v2 API, meaning one checked address equals one query in usage. That means there are no price changes and everyone can use the v3 API immediatly (though it's beta so please be aware of that before deploying it in production). And of course you can use the v2 API at the same time as the new v3 one in different deployments.
Why are we doing this? Hasn't the 3rd party support for v2 gotten really good?
We introduced the v2 API on January 1st 2018 and in those 7 years since then we've added a lot of features to the API that weren't considered at the inception of its output format. The entire reason we launched v2 was to provide multi-checking which is the ability to check more than one IP address in a single request.
And when we introduced that feature with v2 we should have put more thought into its output format so we wouldn't have to launch a new major API version with a new format. We definitely didn't want to go through another major API format change like from v1 to v2 so we spent a long time thinking about the "perfect" format that would last us well into the next decade.
As an example, we know that customers want to be able to see if an IP is multiple things at once, like a hosting provider and a TOR exit node. With our v2 format showing multiple categories just wasn't feasible without breaking the prior implementations of our API that customers had created. So we made the decision to make a brand new major version of the API instead.
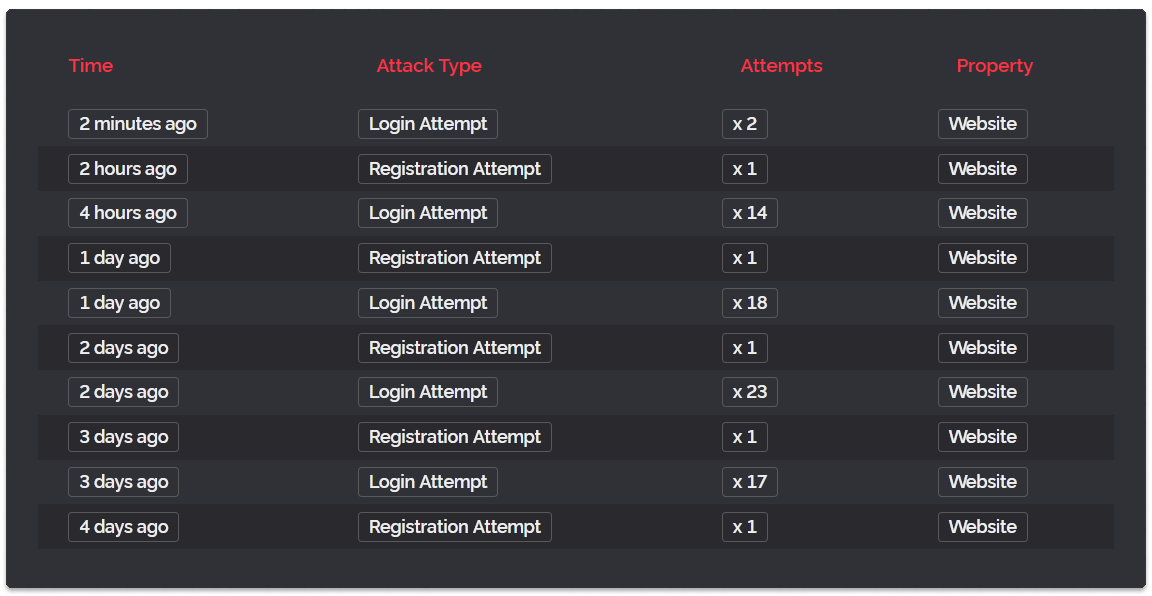
In addition to just altering the API this has also meant we needed to redesign large parts of the Customer Dashboard. The positive detection log for example was not designed to show multiple detection types for a single IP address. So there has been a lot of work this year to bring up the v3 API with full support for everything people expect including Custom Rules, Custom Lists, CORS Domains, Dashboard Statistics and even other less obvious things like customer emails regarding query usage.
What does this mean for the future of v2?
We have methods we devised years ago to support multiple versions of our API's simultaneously and you can still select major versions of the v2 API going back to June 2020 from the customer dashboard. We intend to maintain support for the v2 API for the next 10 years. And in-fact even if you make a request to our long since retired v1 API right now it still works because requests made there are proxied to our v2 API and then the format is adjusted to fit the v1 format.
In the far flung future we will likely do the same for our v2 API so that it will continue to function years after we drop support some time after 2035. So in short, don't feel like you need to rush to upgrade to v3, this is very much going to be a smooth transition on a time table of your own choosing.
The upgraded Dashboard
As mentioned above the Dashboard did have to be upgraded to support the v3 API's data. We have now transitioned all our backend data to new formatting which is more storage efficient, faster to access and with per-minute resolution. This means the bar charts and graphs are more accurate and it's easier for us to maintain because we're not duplicating the data we're recording for different graphs and exportable statistics, it's all now unified. We've also upgraded the v2 API to save its data in this new format that the v3 API uses, in-fact they've been doing so since June this year.
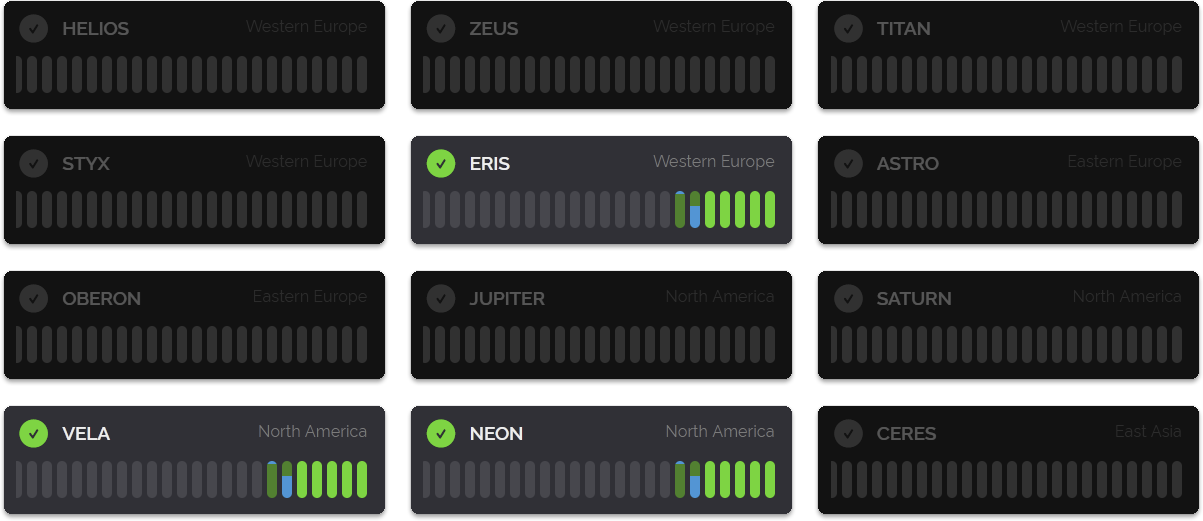
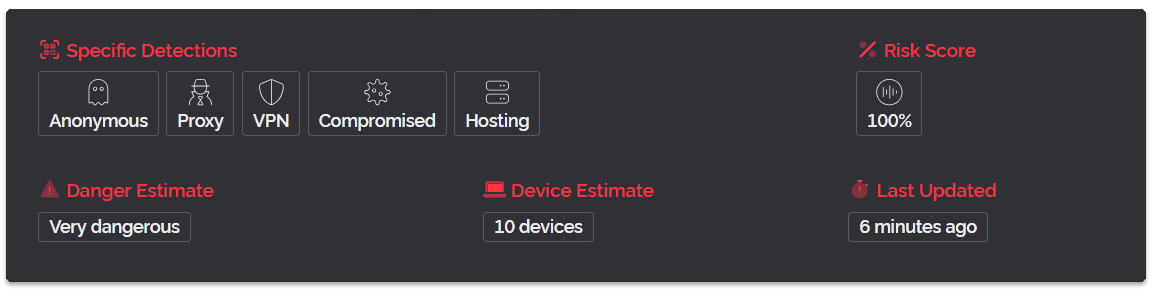
One major part of the Dashboard that is new is the Positive Detection Log, previously each IP would only show a single determination for an IP. So if an IP happened to be hosting, compromised, scraping, VPN and a proxy all at once.. well all you saw was "proxy" and all that other information was not presented to you.
If you're using the v3 API this changes, all of this will now be available to view and this is how it looks in the Dashboard represented by colour coded icons.
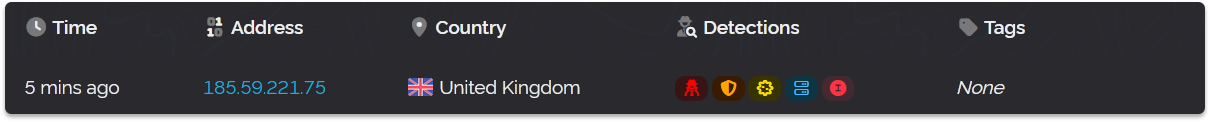
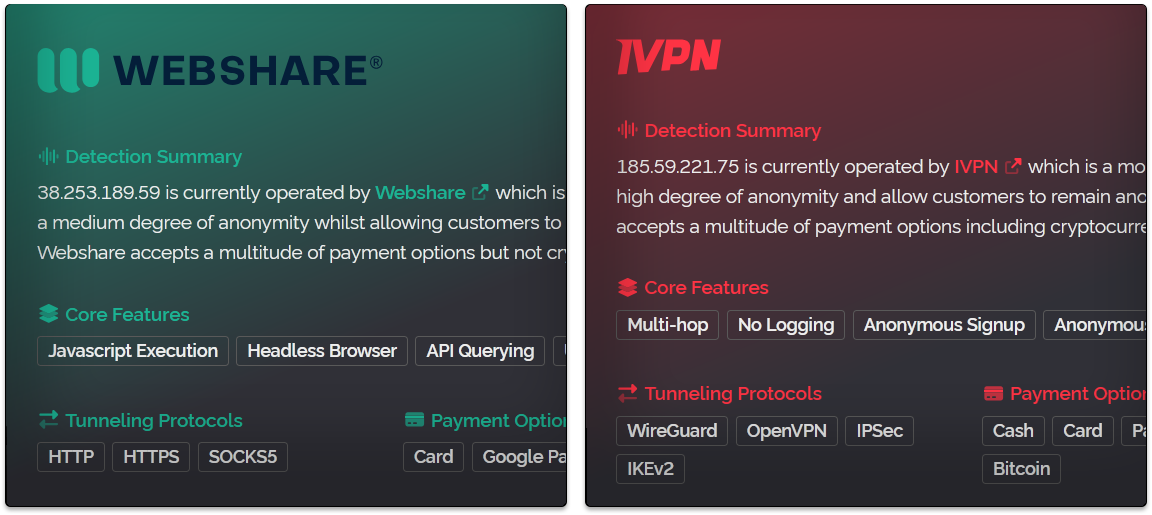
You can hover your cursor over the icons to get a little tooltip explaining what they mean. In the above we have proxy, vpn, compromised, hosting and then a unique icon for IVPN which is a VPN service operating this IP address. All VPN operators will have icons like this which use the first letter of their service and their unique brand colors (clicking them will take you to their website in a new tab).
In addition to these changes we've also made the dashboard much faster to load for subscribed customers. Prior to now when loading the dashboard a server-side connection was made to our payment processor to obtain information like your credit balance and next billing date. This could delay loading the dashboard by several seconds and so we've moved the display of this information to a deferred load.
We've also altered the Dashboard's payments backend, we now support entering your business VAT ID's at checkout, we will remunerate sales tax to your country automatically and we now support setting up plans via Webhook from our payment provider which means if you navigate away from the checkout after purchasing a plan your paid service will still be delivered via webhook.
What happens next?
Now that we've launched the v3 API in open beta we are accepting any and all feedback from you. We will continue the beta for as long as needed to iron out all the issues that get discovered and to also improve the output format. Once it's stable we'll do another blog post to let you know.
And if you're a developer who wants to make a library, plugin or app using the v3 API please do so and let us know, we will feature it in our documentation for users to get going with v3. We currently maintain our own PHP library on GitHub where we will be publishing a development branch to support v3 once it's out of beta.
As always thanks for reading and have a wonderful week!