WordPress Plugin Now Available!

In our yearly retrospective we teased that a WordPress plugin was being made that would be available in early January. Well it was approved much faster than anticipated by the WordPress repository maintainers and so the plugin is available here on the WordPress site right now.

With the release of this new plugin we've also added a dedicated plugins page to the website where we'll maintain a listing of all the plugins that support the proxycheck.io API. As before with our Code Examples page if you've made a plugin let us know and we'll feature it just like we've done with this WordPress plugin made by Ricksterm.

We hope you all enjoy the new plugin and have a lovely new year.


A Giant Year

This year has been giant for us at proxycheck, we added lots of new features and dramatically overhauled our service, website and API. Below we'd like to share with you all the changes that happened this year.

Outreach

  • We started this company blog that you're currently reading
  • We started a GitHub account featuring PHP client code
  • We started a Twitter account and have been tweeting new features
  • We created a new contact us page with live chat support

API

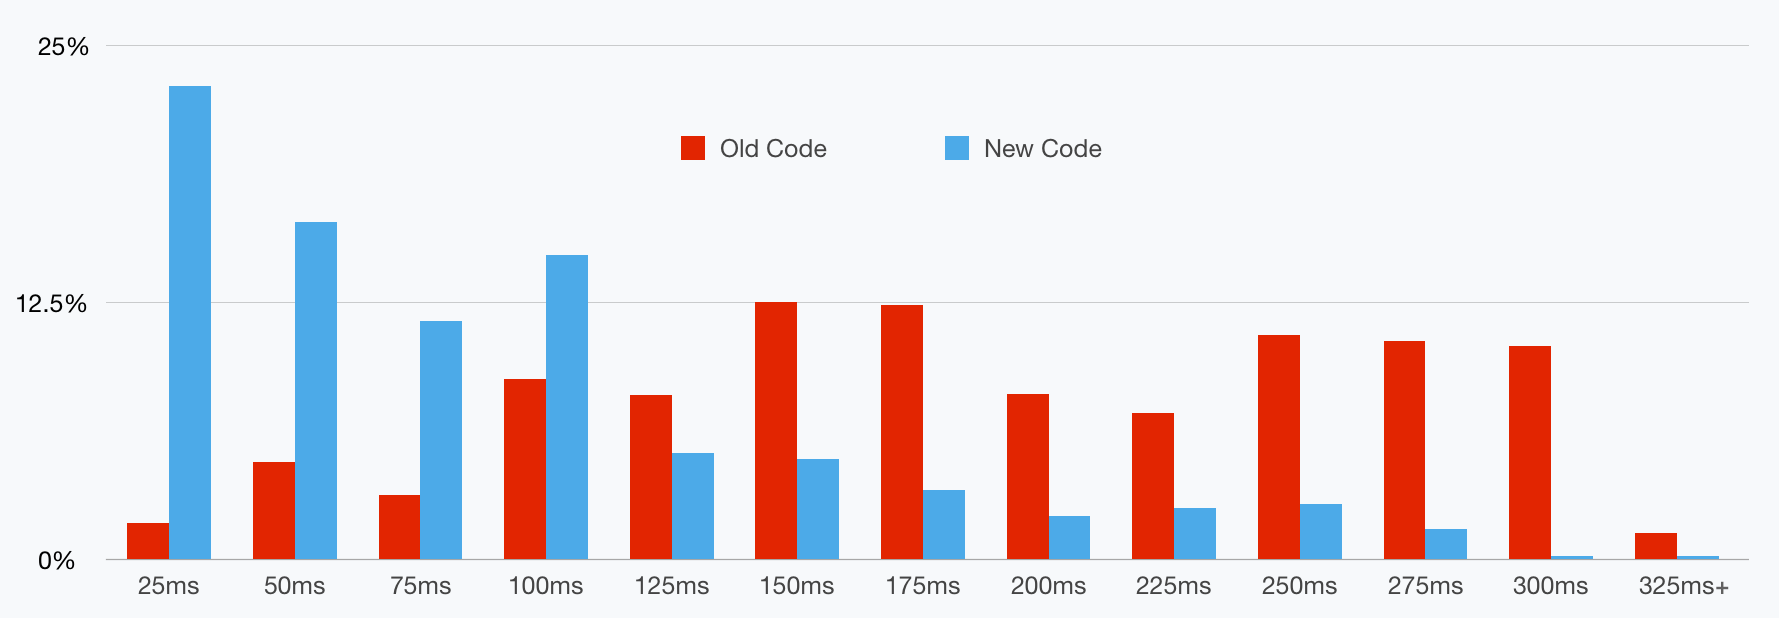
  • We greatly decreased query latency through code refactoring
  • We added query tagging support
  • We built an Inference Engine to discover new proxies and to curate our existing data
  • We created 20 honeypots positioned around the world to capture malicious activity to further feed our Inference Engine
  • We vastly improved our VPN detection
  • We added support for VPN detection in IPv6 address ranges
  • We vastly improved our ASN flag support which now also supports IPv6 alongside IPv4

Website

  • Website gained a new look with drop-shadows, subtle animations and vibrant colours
  • A top navigation bar was added and tab bars were placed on some pages
  • We added a Pricing page and overhauled the Web Interface page
  • We completely remade the Service Status page
  • We made the website more mobile friendly with media queries
  • We remade the API Documentation page which now features dashboard API examples under a new tab
  • We significantly improved our Code Examples page with examples added for python, node.js, C# and Ruby
  • We added Stats, Whitelist and Blacklist features to the Customer Dashboard

Payments

  • We switched from one time yearly payments to monthly and yearly subscriptions (which you can cancel at any time)
  • We expanded our plan sizes into lower and higher priced plans (plans from just $1.99 a month all the way to $99 a month).

Infrastructure

  • We added a third server node to the cluster called ATLAS
  • We altered our international routing to enable lower latency access to our server nodes worldwide
  • We significantly upgraded our PROMETHEUS node going from 6 to 16 CPU cores

Email

  • We greatly improved the appearance of our emails and now bundle our CSS in the email itself for reliability
  • We standardised all our emails look and feel by creating a standard callable email function used by all our code
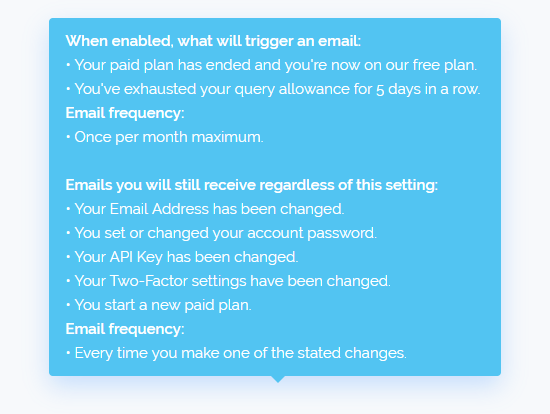
  • We send more emails to you for things like email/password changes and query overages, payment failures etc

With all these changes the service has become really fleshed out but we're not done. We still have features planned for next year including our new API that allows upto 100 IP Addresses to be checked in a single query.

We're also working on a batch processing and webhook system which we think will be very beneficial to some of our largest customers, this should be available some time early next year after the multi-check API is brought online.

The final thing we wanted to discuss is our free tier and how we've been distributing larger free plans to communities that need them most. Protecting websites, forums, game servers, payment gateways and more is something we're very proud to do and our service was actually started due to our founder needing this very service to protect their own online properties which included chat rooms, forums, websites and game servers.

That's why we've from the very start offered a generous 1,000 free queries to anyone that signs up, we have no intention to restrict that offering or to disable our premium features. We're aware that there are many competitors in this space that differentiate between free and paid customers by restricting features such as limiting Whitelist/Blacklists, not offering statistics or easy to access online support. We're different and proudly so.

We've also gone out of our way to give larger free plans ranging from 10,000 to 80,000 daily queries to many people who run free online games, chat communities, forums and support groups. We're proud to support forums that help teenagers and young adults with thoughts of self harm and also open source developers who release software we all benefit from.

This year has been really great for us. We've seen huge volumes of new customers and also many developers across the web integrating our API into their products and services, in-fact we have a WordPress plugin being developed on our behalf which should be available in January.

We'd like to thank everyone who has taken a chance on our service and we're really looking forward to bringing you new features and improvements next year and with that last sign off we also want to wish everyone a Merry Christmas and a Happy New Year.


New Dashboard Graph

The stats tab in the dashboard is the most heavily trafficked part of the site for registered users and that's because it's where you gather insight about the positive detections being made by our API on your properties. It's also where you can monitor your query allowance to make sure you're not going over your plans daily allotment of queries.

Today we're improving the stats tab with a new graph so that you can quickly see what your months been like without needing to page through each days queries. We're still giving you those full granular bar charts and the JSON API is still there for you to export and graph your queries however you wish but we've built in a really nice graph as shown below.

Our new graph is fully interactive so you can just hover your mouse over the data to see detailed number breakdowns and you can also toggle parts of the graphed data by clicking on the keys along the top. This is especially useful if only a small amount of your queries are positive detections which is common.

We know that you'll find the new graph useful as we're often asked by current customers what sized plan they should purchase based on their current usage. The new graph will make those decisions easier, especially as it shows your highest query days as large peaks and those are the days you want to plan ahead for.

This is likely the last major update we'll be releasing before the new year as we're winding down things for the Christmas break and new year celebrations. Thanks for reading and we hope everyone has a wonderful holiday and a happy new year.


Multi-check API update

Since we launched our multi-check API yesterday we've been hard at work improving performance and squashing bugs. Today we'd like to share with you some progress.

Firstly there were some bugs with the IPv6 VPN detection with regards to Google address spaces. This has been corrected in both the /v1b/ endpoint and in the back-ported code which is running on our main /v1/ endpoint.

The second IPv6 bug we had was with VPN detection. If you had not set the VPN flag to on but checked an IPv6 address it would be checked against our VPN data and a positive VPN result presented. This has also been corrected today in our /v1b/ and /v1/ endpoints.

The third bug we dealt with today was with dashboard statistics. Under certain circumstances you may have had a discrepancy in your total API queries reported at the top of your dashboard compared with the graphed breakdown of your query statistics. This was caused by underreporting on some negative detection scenarios. This bug only affected our /v1b/ endpoint.

Apart from fixing these bugs we've also corrected some very specific edge-case bugs. For example when performing a single IP check and the address entered into whitelisted IP ranges you may have received a response without the IP Address being repeated back to you in the JSON response. This behaviour has been corrected.

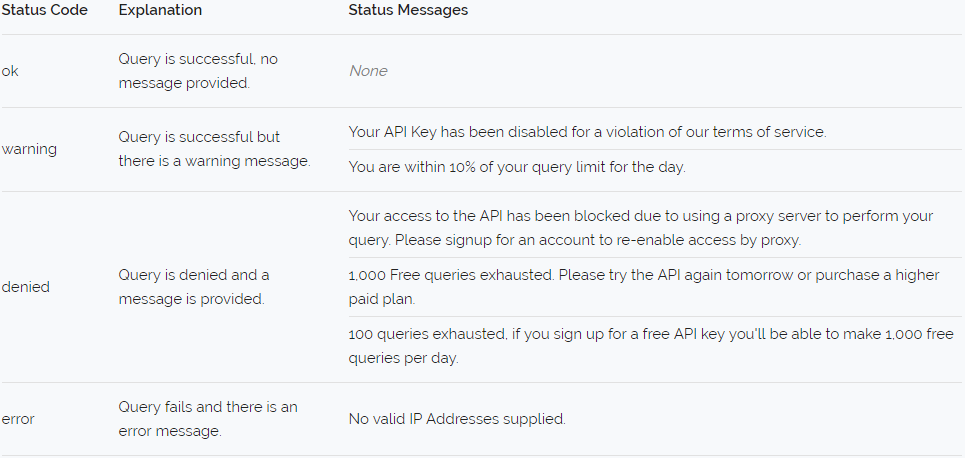
New functionality wise we've improved how we handle invalid IP Addresses. So previously you would simply receive a vague message indicating that one or more addresses were invalid but it didn't list the actual addresses you supplied. That's not an issue when you're checking a single address but with multi-checking you need to know which addresses in the data you've sent to be checked were invalid. To that end we now display that information back.

We're also planning to improve the 100 check per query limiter code. At present it simply stops processing your addresses once it reaches 100 and does not output to you a list of unchecked addresses. We'll be changing this behaviour soon to indicate which addresses were unprocessed due to hitting the limit. We'll also be changing statistic behaviour to account for this, at present if you send us 500 IP's you'll have 500 queries registered to your API Key even though we only processed the first 100.

So that's a quick update of where we're at. The new API is coming along steadily, we've already improved the performance since yesterday and we're squashing all the bugs we find as quickly as possible. We're on track for an early January 2018 rollout to our main API endpoint address.

Thanks for reading and have a great day.


Introducing IP Multichecking to our API

One of the biggest requested features from our customers over the past year has been the ability to check multiple IP Addresses within a single query. This feature has many benefits including reduced TLS handshake times, reduced resource usage from multiple webserver connections and decreased API latency through resource reuse.

To put it simply, it's a lot faster to perform one query with a 100 IP payload than it is to perform 100 queries with one IP payload each. We've tuned the new API for this multi-payload scenario and the performance improvement is dramatic as our benchmarks will show.

Before we get to those, we're considering this feature experimental. Due to this, the enhanced API is only accessible through /v1b/ with the b meaning beta. We're also supporting the submission of IP Addresses via GET and POST. You should use POST, the GET input is just there for testing in your browser.

We also want to be clear that this is not simply an abstraction endpoint that calls our API internally (and individually) we have literally gone through the API and rewrote every part of it to handle multiple checks. So this differs to how our web interface page has functioned (we will be transitioning that page to our new API soon).

So lets get to the benchmarks. Firstly we performed our testing multiple times with different addresses and averaged the results. There was not much deviation between tests. We did all our tests with 100 IP Addresses and we used TLS encryption.

IP Addresses that are NOT already in our data set with real-time Inference Engine turned ON

  • v1 (current) API with 100 queries each with 1 IP Address: "query time": "65.35s"
  • v1b (beta) API with 1 query containing 100 IP Addresses: "query time": "36.184s"

This is an impressive reduction, but watch what happens when we disable our real-time Inference Engine.

IP Addresses that are NOT already in our data set with real-time Inference Engine turned OFF

  • v1 (current) API with 100 queries each with 1 IP Address: "query time": "45.221s"
  • v1b (beta) API with 1 query containing 100 IP Addresses: "query time": "6.133s"

Now we're seeing a much larger decrease in query time. To be clear, our past Inference Engine cached data is still being processed here, so all past determinations made by the real-time and post-processing Inference Engine are still being utilised here but actual live determinations have been turned off.

Now finally lets take a look at positive detections. This is where the IP Addresses being tested (all 100) are already present in our data set but not within caches. So it's still searching all of our data but it's finding matches throughout our data set as opposed to never finding a positive detection like the tests above.

IP Addresses that ARE already in our data set with real-time Inference Engine turned ON or OFF

  • v1 (current) API with 100 queries each with 1 IP Address: "query time": "22.372s"
  • v1b (beta) API with 1 query containing 100 IP Addresses: "query time": "0.639s"

Here again we're seeing a huge decrease in query time. This is where we're seeing multiple TLS Handshakes and HTTP Connections being removed from the query overhead and our in-memory resource reuse has come into play.

So how do you start using the new API. We've made it really simple when you perform a query to the v1b API with multiple IP Addresses simply place multicheck in the IP field and then provide your multiple IP Addresses in a POST request called ips with each IP separated by a comma. If you want to use it in a GET request instead change the singular IP to multiple IP Addresses also separated by a comma. Below we've provided two examples.

GET request example

POST request example

You can still use your normal flags with these requests, for example ASN, VPN, Time, Node and we've introduced a new flag just for v1b called INF and as you probably can guess this disables our real-time Inference Engine so that you can perform multiple checks faster. To disable this feature provide &inf=0 in your request as by default it's turned on.

We're limiting multi-checking to 100 IP Addresses per query right now but we do intend to increase that limit after it comes out of beta. We hope you will all give it a good try and provide us some feedback which we welcome you to do at [email protected]

The last few things we wanted to mention about the new v1b endpoint is it does still support singular IP checks and the JSON result format is exactly the same as it has always been when perfoming a single IP check. You will see the new multi-check format only when performing multi-checks.

And finally since this is our new API we are working on it full time now. It has some added enhancements that our older API didn't have including better IPv6 support for VPN detection (since backported to /v1/ today) and we've moved around where certain checks are performed so you can now blacklist Google and Cloudflare IP Addresses, Ranges and ASN's from your dashboard and have those blacklists adhered to where as before they weren't.

Thank you for reading, we hope you're all having a great week and we look forward to hearing your feedback about this new feature.


Realtime Inference Engine Improvements

In our previous update we shared with you the accuracy improvements we've made to our post-processing Inference Engine. This is the part of our service that searches for active proxies within our negative detections and from our Honeypots positioned around the world.

Today we've enhanced our real-time Inference checks which are performed at the same time as your queries. Prior to today only 1/3rd of our Inference Engines capability was utilised for real-time checks due to the time it takes for determinations to be made.

But we've now enabled 2/3rds of our Inference Engines checking capability for real-time queries. Based on our testing this means 95% of all Inference Engine based determinations on your queries will now occur at the point you perform your query.

That means you're much more likely to receive a complete result the first time you check an IP Address as opposed to us only detecting an IP as being a Proxy Server after you've performed your query and already received a negative detection result.

Prior to today about 65% of our Inference Engines positive detections were performed in real-time so this is a rather large increase in real-time detection rates. The final 5% will still be detected in post-processing with the entire Inference Engine enabled but we're hoping to further improve performance here also to be able to offer it in real-time at a later date.

While we have been able to tune the real-time Inference Engine considerably to allow for 2/3rds enablement there is a small latency increase on queries by roughly 70ms. The thing to keep in mind here though is these increases only occur for what would otherwise be negative detections. If an IP Address has already been run though the Inference Engine or otherwise detected in our dataset as a Proxy or VPN Server you won't incur this extra latency so think of it as an added accuracy tradeoff.

As always we're working to improve the performance of the API so we can answer your queries faster and support more queries per second, improving our real-time detection rate is one of the core benefits of improved API performance as our detection accuracy directly correlates to how much CPU time we can spend on each determination.

We hope you found this post interesting, thanks for reading!


Inference Engine and API Improvements

Inference Engine Improvements

Over the past few days we've been working on improvements to our Inference Engine. Specifically making it work across more processing threads simultaneously and efficiently while decreasing its rate of false positives.

We recently upgraded our Prometheus server node from a 6 Core, 12 Thread XEON to dual 8 core, 16 thread XEON processors. Giving us a total of 32 threads and a giant 50MB of L3 Cache. These processors also have much higher frequency with a base clock of 3.6GHz and a maximum turbo-speed clock of 4GHz.

With this new hardware we've seen a dramatic 181% uplift in performance for our multithreaded workloads. Every part of proxycheck.io is multithreaded, it's one of the ways we're able to deliver such high performance for the millions of queries we process daily.

But some of the post-processing we do such as with the Inference Engine to discover new proxies did have some performance hangups under certain scenarios which could reduce performance. Tuning your software to take advantage of 32 processing threads is not an easy task and it's a big jump from the 12 threads we were using previously.

We've had to tune the software not just to take advantage of the extra threads but also to understand NUMA (Non-uniform memory access) so that our threads are working on data in the RAM connected directly to the processor the thread is running from. We've now completed the rewrites necessary for our new hardware and we're seeing dramatic increases in performance on this node.

Due to this performance uplift we've been able to spend more time training our Inference Engine and with the extra computation time available each determination our inference engine makes is more thorough than ever before which lends itself to increased accuracy.

We're now seeing a 0.02% reduction in false positives in our training models which equates to 2,000 less false positives per 10 million determinations.

API Improvements

Over the past several days we've also been hard at work on the API itself. Not only to tune it for our new multi-processor node but also to fix some bugs including one with ASN's and special characters. When receiving an ASN result we tell you the provider name, sometimes these providers have special characters in their name for example Telefónica has a special ó in their name. This caused an encoding error with our JSON encoding which resulted in null results.

We've corrected this by encoding all provider names before the JSON encoding is performed. We believe very few results were affected by this issue which was caught by our own Ocebot during its automatic API probing.

That's all we have to share with you today. We hope you all had a great weekend.


Degraded cluster performance

As of right now two of our three node hosts are having peering issues. We're monitoring the situation closely. All of our services are online and available but you may find some queries taking longer than usual to be answered.

EDIT:// Stats within your Dashboards are delayed at the moment while we work on cluster maintenance. Thank you for your patience.

EDIT2:// We have re-enabled stat collection, we believe some stats created by our ATLAS node have not all been reported to the cluster accurately due to its network issues combined with the stats accumulating in our database updating coalescing cache. Due to this cache becoming full new stats couldn't enter the cache and old stats couldn't be reported accurately due to packet loss. This has resulted in some stats being lost. This means your query volumes for yesterday and the first two hours of today are lower than they should be (in your favour, as you receive more queries for free basically).

We apologise for the disruption to our stats feature, we're working to make sure this doesn't happen again by building in secondary disk based file caching to hold stats that cannot be committed in a timely fashion for later processing.

Thank you.


New dashboard API

Since we added the whitelist and blacklist features to the dashboard in may earlier this year we've wanted to add a powerful JSON API for them enabling you to fully manage your whitelist and blacklist with your own software in an automated way.

It has also become one of the most frequently requested features and today we're happy to deliver this feature to you. If you just wan't to get integrating head on over to our API Documentation page and click on the new Dashboard API Information tab.

Using the new API you can list, add, remove, truncate and clear your whitelist and blacklists using standard JSON, GET and POST requests. This enables you to completely manage your whitelist and blacklists without needing to login to your account but you can still do that of course.

We consider this feature beta but stable, there are no outstanding bugs as of right now but if you see any please feel free to message us, we've spruced up our contact us page as-well.

Thanks for reading and have a great day!


Improving our VPN detection

Over the past few weeks we've been adding many new VPN services to our detection system and we're now at 250 individual service providers that we detect. The main way we've been going about it is detecting Data Centers and Service Providers that offer commercial hosting and thus enabling us to detect all the middle-men VPN providers that rent their servers.

We've also received a lot of leads from our users. It has been made clear to us that VPN detection is very important to our customers. We're incredibly thankful to those of you who have been sending us IP Addresses we missed and service providers we don't yet detect.

While adding many of these VPN services to our database we did find some bugs with our API VPN database lookups. Specifically when a VPN Provider had a great many addresses their IP's weren't being detected consistently due to an exhausted key buffer. This was caused by a very simple code error on our part which we have since resolved. From our data we believe 5% of all our VPN entries were affected by this bug.

Being a well rounded service which means the accurate detection of VPN services and not just Proxy Servers is of paramount importance to us and we are laser focused on adding as many VPN services as possible to our database.

Thank you for reading this post and please feel free to contact us via Skype, Web chat or Email to provide us with the IP Addresses or the names of VPN services we're not currently detecting, all of this data is incredibly valuable to us.


Back