The title of this post is a common phrase you will read online when viewing forum posts within privacy minded communities. And in general it's true and has been true for as long as products have been offered for "free" to consumers.
Since we started we've had customers enquire about what we're doing with the data they send us. Specifically when they send us a customers IP Address do we correlate that with their web property and then sell that information.
For example if you operated a store that sold Guitars and you use our service for your registration or checkout system are we recording the IP Addresses you send us for proxy checking and then handing that data off to a marketing company so they can run targeted ads to your visitor for Guitar related products.
With the recent Cambridge Analytica disclosures involving Facebook we've been asked this question much more frequently than before and we thought it would be a good idea to write a blog post about our stance on this.
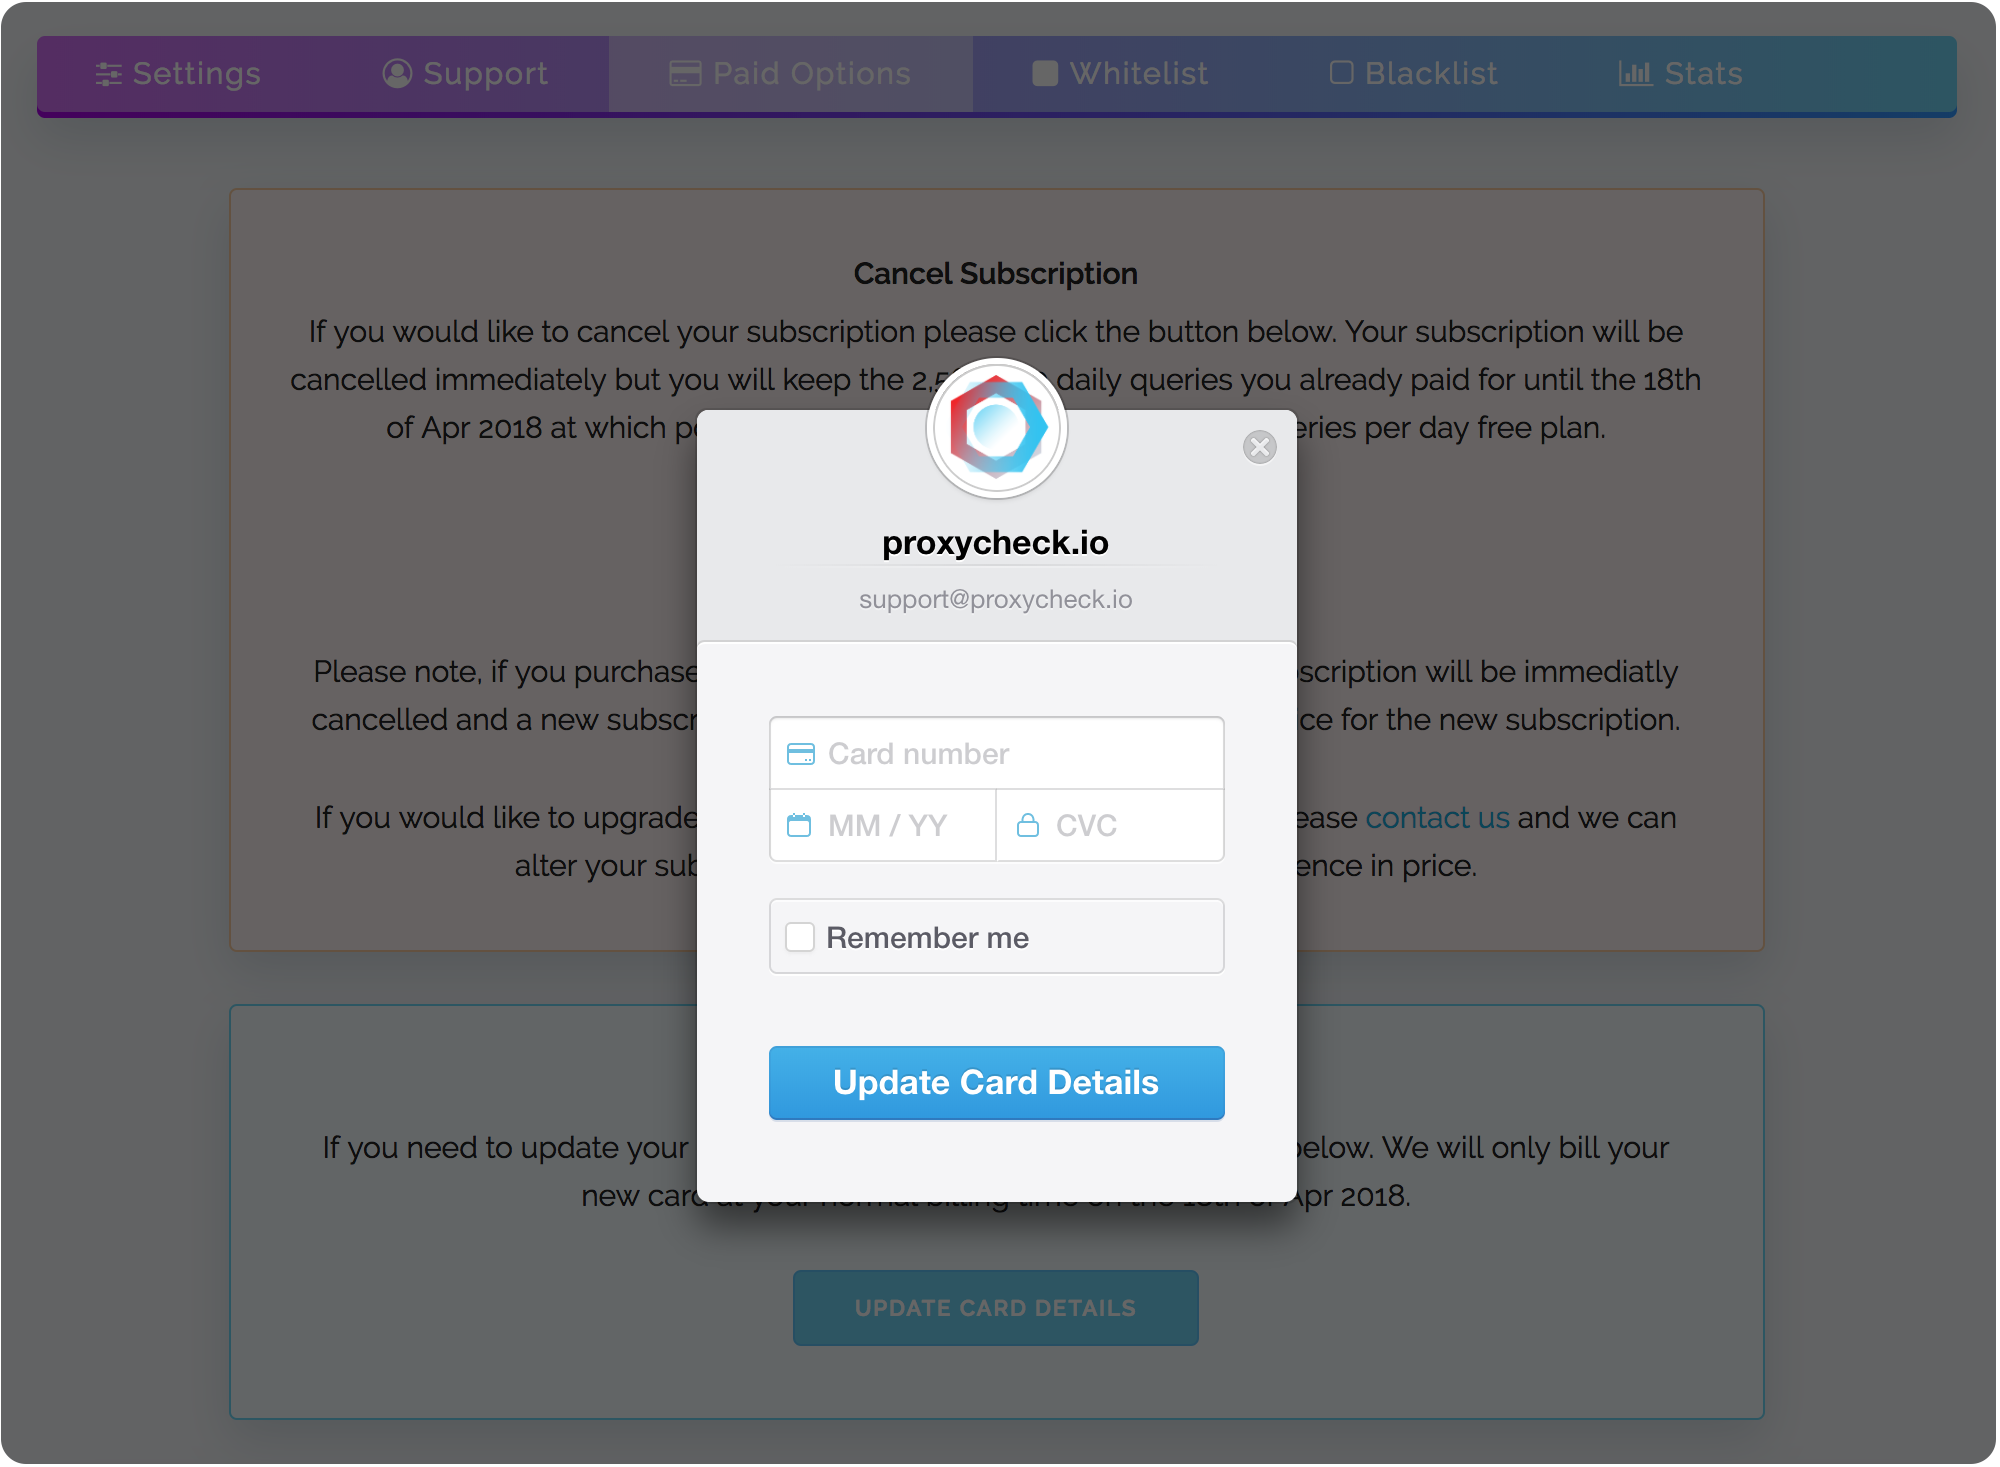
So the question is, do we sell your information? and the answer is no, we do not sell your information. Infact we do not make available any of the data our customers entrust with us. The only third parties we ever allow to handle your data in any way are Stripe which is our card payment processor and mailgun and both of these companies only receive the bare minimum of your personal information to perform the duties we've entrusted with them.
For Stripe that means your bank card information to perform transactions and for mailgun that means your email address. Beyond that they don't receive anything else and neither does anyone else. We simply do not make available customer information in any form even as aggregate data to any third party, period.
Now of course the question is if our free customers aren't our product how are we staying profitable? Well our business model is built around converting free customers to paid customers. We give unregistered users 100 queries per day and we give registered users 1,000 queries per day. Both for free.
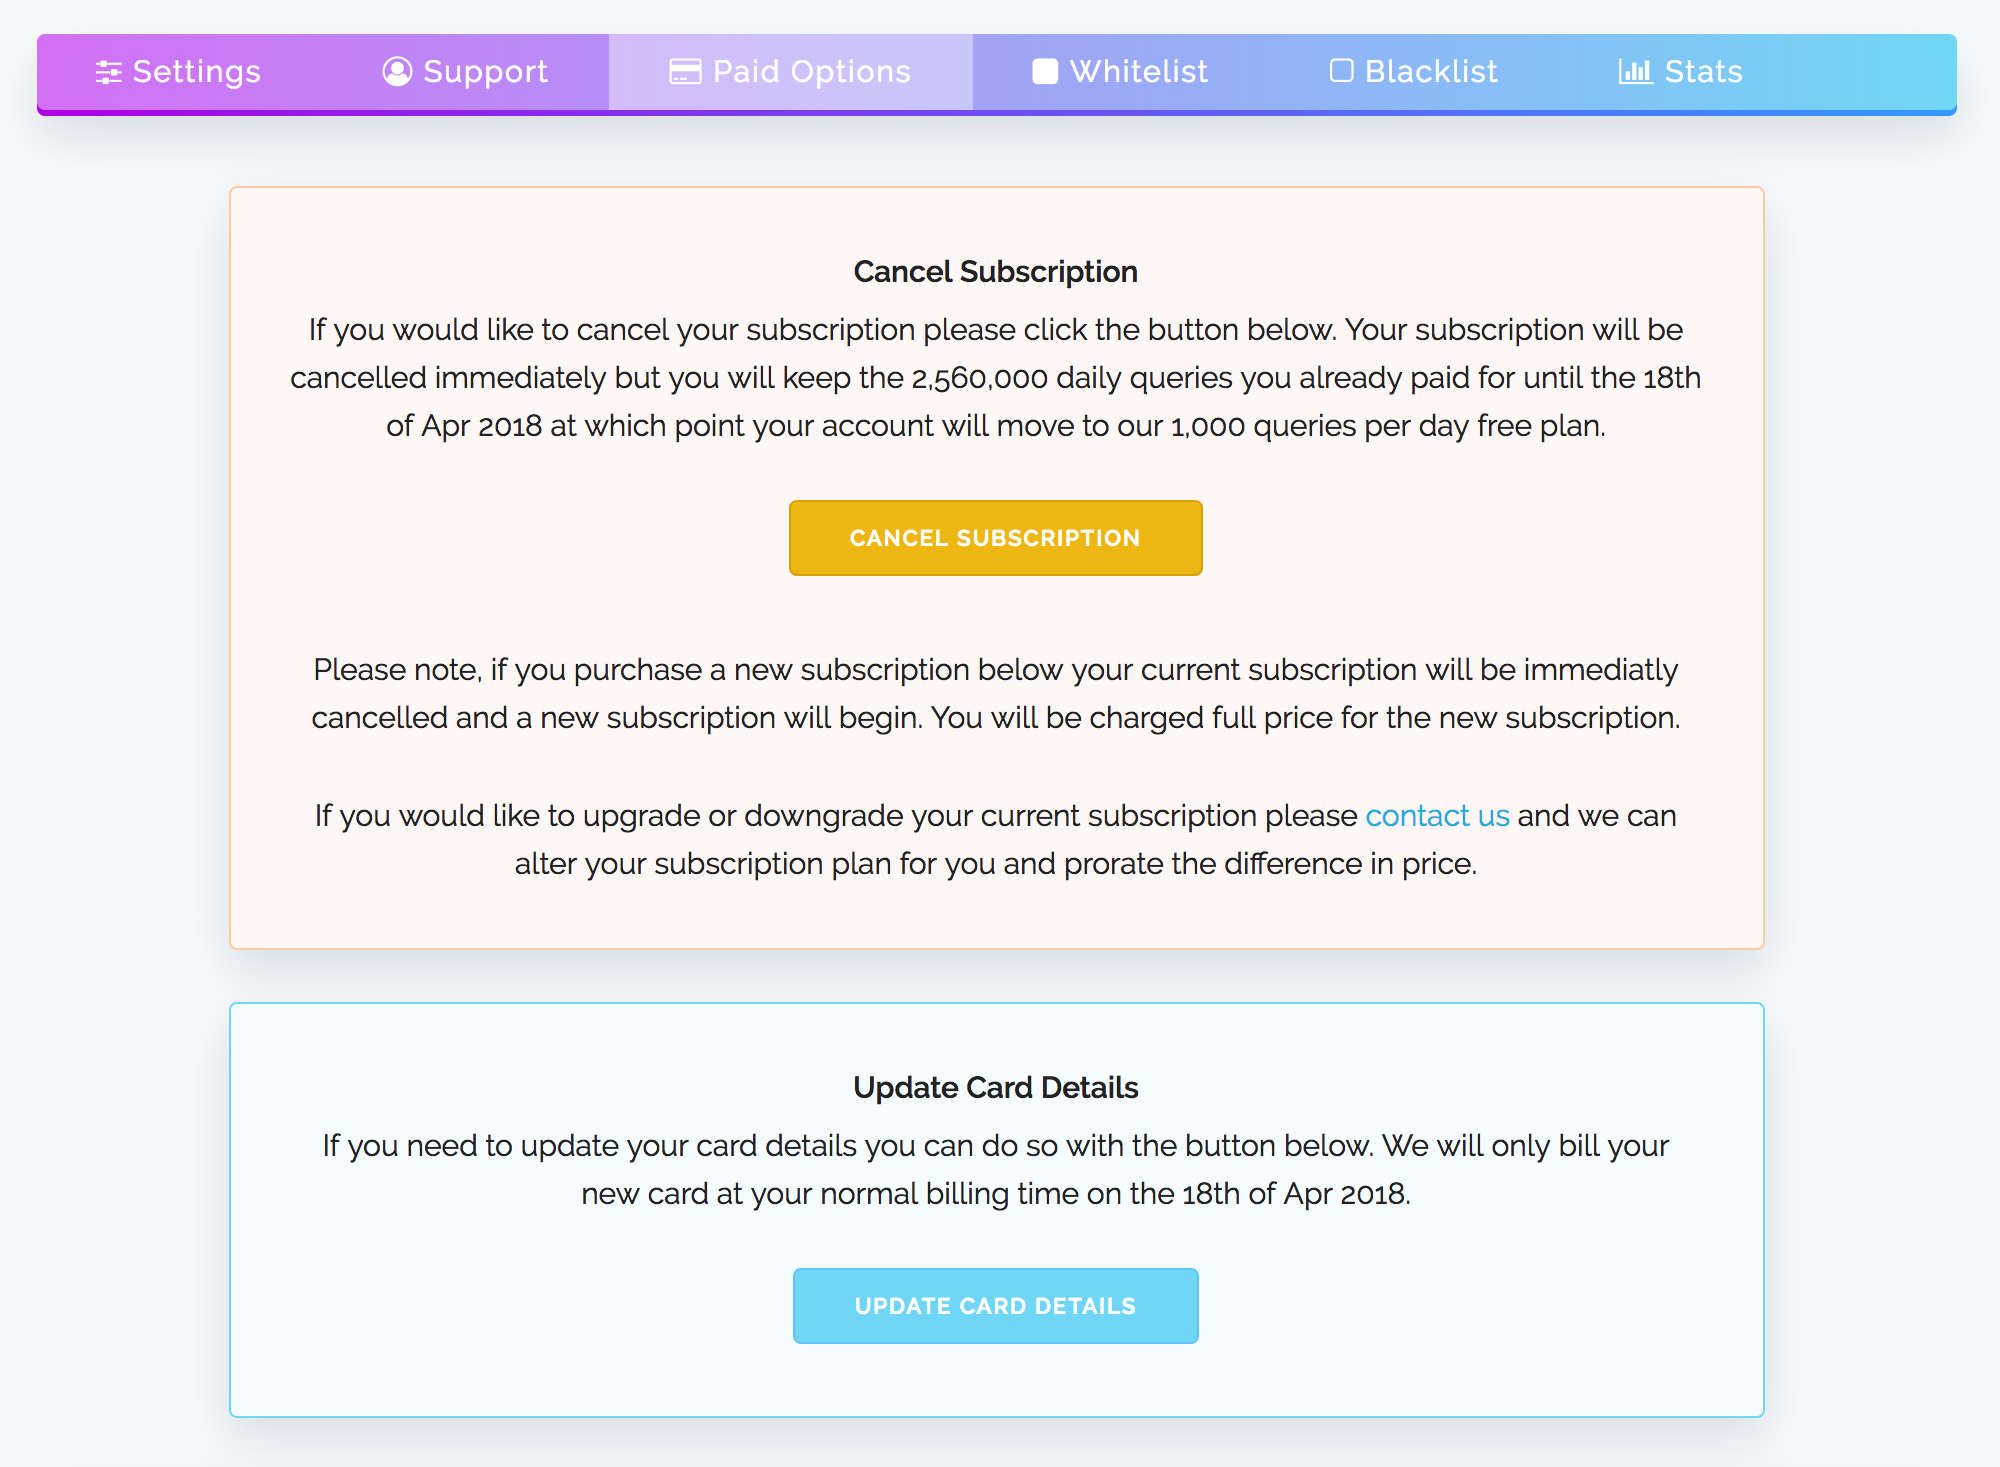
Then as those customers needs grow, meaning they're regularly making over 1,000 queries per day we attempt to convert them into paying customers. We do this in a few ways, firstly the stats on the dashboard help users to determine their own query volume needs and secondly when you go over your query allotment for five days in a row we send you a single email to let you know.
Essentially a single $29.99 subscription which is our most popular paid plan right now can subsidise the usage of several hundred free users. That's part of what enables us to offer a very competitive free plan with feature parity to our paid plans.
The other part is that we designed proxycheck.io from day one to scale across multiple servers. Not just the API but every facet of our service like our website which includes the customer dashboard and web interface. As the queries hitting our API have grown we've been able to efficiently meet that increasing demand with very little waste due to the cluster.
With some of our competitors infrastructure we've seen them place free customers on one server and paid customers on another server. We've also seen competitors setup single dedicated servers just for single paid customers. While that sounds very premium on the surface, the reality is that's increasing the chance of failure and it's very inefficient business wise as you will have under-utilised resources which you have to pay for regardless of that servers actual usage, it also makes their premium plans exceedingly and in some cases outrageously pricey. Essentially you pay more, but you get less.
Our custom cluster architecture has allowed us to maximise our resource use so that all of our customers benefit equally from the increased performance and redundancy that adding more servers to the cluster brings while keeping our costs low as we don't have to keep paying for under-utilised servers. All of that means we can offer our generous free plans while respecting all of our customers privacy.
When companies sell their customers data while also having paid plans we call that double dipping. Frankly we think the privacy situation globally right now is in a very poor state and we don't want to be a part of the problem. We have welcomed the GDPR (General Data Protection Regulation) because for too long internet companies have been operating like it's the wild west when it comes to user privacy and user data ownership rights.
We hope this blog post has informed you on our stance, we have no plans to make available customer data to third parties, frankly we don't want to know who your website visitors are or what your website does. All we're interested in is making the best Proxy and VPN detection API at the lowest possible cost and we can certainly do that without invading anyones privacy.
Thanks for reading and have a great week!