v3 API development update, dashboard update and more

Image description

v3 API Development Update

Today we're going to give you an update on the v3 API since our launch of the open beta from 10 days ago. We've been making some logical changes to how the risk score works, how we determine an IP is anonymous and we've also discovered and corrected some issues around certain detection types.

We've also deployed the API on some websites and services both run by us and in cooperation with some customers so we can discover and correct issues faster. It was a result of this that the above issues were found and fixed.

We mentioned above the risk scoring has been changed. We've also updated the API documentation to reflect this which you can view here.

Dashboard Statistics Performance Update

When we launched the new version of the Dashboard we did have a stretch-goal of improving the time it takes for the statistics you generate (by making queries) to show up in the Dashboard. We were not able to complete this before the launch so it was pushed back but I'm happy to say we launched it just under a week ago.

This did require a significant rewrite to how we collect and process statistics which is why we decided to push it back instead of rushing anything through that could potentially cause statistic losses or data corruption.

So the end result of this work has been that it's now possible to generate a query and have it appear within your Dashboard in only a few seconds. Now it's still unlikely to be that fast but we're now often seeing positive detection log entries and other statistics showing within 30 seconds as opposed to upto 8 minutes that we had seen in recent times.

The reasons that the statistics had begun to lag behind is four fold.

  1. We began to highly compress statistics to reduce loading times of data from disk to memory and to reduce storage use. This caused a high amount of CPU usage when altering statistics as it required reading data, decompressing it, altering it, compressing it and then saving the data back to disk. Although it was only a few milliseconds per account it adds up.
  2. We have gained a lot more customers since we last altered how statistics are handled, we've grown by more than 1000x. So there's just a lot more statistics to process.
  3. We had structured processing around 60 second intervals. Sometimes that meant the processing completed fast and there were many seconds where the processor did nothing allowing the next 60 second interval to accumulate a lot of extra data. Essentially this fixed sized processing window created inefficiencies.
  4. Data was only collected from our nodes once a minute so if you happened to generate a request on the very first second after a collection of data had taken place you would "miss the bus" so to speak further delaying your statistics by a minimum of 1 minute and often longer due to the above processing overhead.

So to solve these problems, first of all new fresh data is no longer compressed, it is instead compressed later by different processes. This single change decreased statistic processing time from a 75 second average to only 15 seconds. We also made the processor multithreaded on a per-account basis (to make sure there's no race conditions where two threads try to alter the same customers data at the same moment).

We also altered how the processing timer works, we no longer stick to a 60 second window, instead the processor runs on all the statistics there are and once finished, checks again for new stats to process and then processes those. Everything happens much more fluidly and by processing statistics near-instantly it stops a large queue from forming which also results in faster time to process what data there is.

The final thing we did is we altered the data collector to work similar to the processor. Each of our servers that need to present or collect data will now do so using events to indicate to each other when there is data ready to be collected. This is how we're now able to sometimes get to a sub-5 second query-to-log situation with the new code, the stats are both collected and processed more often.

Some of the work to make this possible was done with the introduction of the v3 API and how it structures data, we back-ported this to the v2 API prior to launch on the 19th of August, each piece of statistical data is now stored uniquely without data reads or alterations, this reduces I/O-based blocking where you want to write data to something that is currently already being read or written to. And since each piece of metadata you're generating is now saved uniquely for each request you make to the API it allows them to be processed near-instantly since we don't have to wait for a large amount of correlated requests to be batched together.

There is still more we can do here, we would love to get the time-to-log near-instant (1-3 seconds) and that may be achievable with further optimisations.

Scraper Services

Last year we made a blog post where we were taking aim at scraper services, we have built profiles for many of the popular ones in the space that offer scraping via residential proxy (and there are a lot of these). But we've been largely silent on our efforts on these services since then. We have over the past week added 10 new services with full provider data and we're actively looking to add more.

It is our goal to have added 100 new ones this year especially as we feel it's so important that we added a specific scraper detection type to the v3 API (and the v2 API also presents these under the type: field). We have seen over the past few years that these services have exploded in popularity as many AI LLM companies are attempting to scrape every webpage in existence and have found themselves foiled by services like our own that list their hosting providers. As a result they're turning to paid residential scraping services to scrape data and these usually go undetected.

This is why we're taking a much more active approach to these, indeed we're signing up and paying many of them just to get access to their fleets of residential addresses and honestly it's very expensive to do it this way but it's the only reliable method. For the time being we're using a phased approach targeting the least expensive ones first and seeing what kind of results that nets, already we've noticed a lot of the services are sourcing their proxies from the same place.

So that's the update for now!

We hope you're enjoying these blog posts where we detail what we're working on, we're very excited about the new API and thankful for all the feedback we've received so far, each piece we get inches us closer to a fully stable release. Thanks for reading and have a wonderful week!


Introducing our new v3 API and Enhanced Dashboard

Image description

Today we're launching a new major version of our API as an open beta. This new version radically alters the output format of our API, provides much more information and enhanced performance for our largest customers.

In addition to the new API we've also launched a new major version of the Dashboard which supports v2 and v3 customers together with enhanced graphs, new data export formatting, updated iconography and crucially for our paying customers a faster initial loading time that matches what free customers have been enjoying.

The new v3 API

So lets get started with the v3 API and what's different to the v2 API. If you just want to head to the documentation and read through all the details and check out the test console you can do that here. But for a quick overview here is what's different.

  1. We have a brand new output format that puts all the data within categories like network, location and detections.
  2. We've renamed some output keys so they make more sense, isocode is now country_code as an example.
  3. We no longer present obscure detection types, we present categories instead such as proxy, vpn, tor, scraper, hosting etc
  4. We've moved from yes/no responses to booleans meaning you wont have to do string conversions in your code anymore.
  5. Almost all query flags such as vpn=1 and asn=1 have been retired, you'll now receive a full result by default.
  6. We're responding with official HTTP response codes for denied and refused queries, no longer will every response just be 200 OK.

Below is a screen capture featuring an IP check performed on our v2 API on the left and the new v3 API on the right.

Image description

As you can see, a lot of the same information from the v2 result is still featured in the v3 one, although in different sections and with renamed keys. However there are some differences, the v3 API now lists the network type as its own definition in the networking section and there is a new detections section featuring many true/false statements about what the IP is doing.

In-fact we cut out a large portion of the v3 result for brevity as it's detecting a specific VPN provider in this result while the v2 result omits this completely because the proxy result (SOCKS5) has overwritten the VPN result, something the v3 API doesn't do.

The main thing to pay attention to if you've been using proxy: yes from the v2 API format to determine if a user should be denied access, instead use anonymous: true from within the detections category section of the v3 API result.

One last thing to mention about the v3 API specifically, it costs the same as the v2 API, meaning one checked address equals one query in usage. That means there are no price changes and everyone can use the v3 API immediatly (though it's beta so please be aware of that before deploying it in production). And of course you can use the v2 API at the same time as the new v3 one in different deployments.

Why are we doing this? Hasn't the 3rd party support for v2 gotten really good?

We introduced the v2 API on January 1st 2018 and in those 7 years since then we've added a lot of features to the API that weren't considered at the inception of its output format. The entire reason we launched v2 was to provide multi-checking which is the ability to check more than one IP address in a single request.

And when we introduced that feature with v2 we should have put more thought into its output format so we wouldn't have to launch a new major API version with a new format. We definitely didn't want to go through another major API format change like from v1 to v2 so we spent a long time thinking about the "perfect" format that would last us well into the next decade.

As an example, we know that customers want to be able to see if an IP is multiple things at once, like a hosting provider and a TOR exit node. With our v2 format showing multiple categories just wasn't feasible without breaking the prior implementations of our API that customers had created. So we made the decision to make a brand new major version of the API instead.

In addition to just altering the API this has also meant we needed to redesign large parts of the Customer Dashboard. The positive detection log for example was not designed to show multiple detection types for a single IP address. So there has been a lot of work this year to bring up the v3 API with full support for everything people expect including Custom Rules, Custom Lists, CORS Domains, Dashboard Statistics and even other less obvious things like customer emails regarding query usage.

What does this mean for the future of v2?

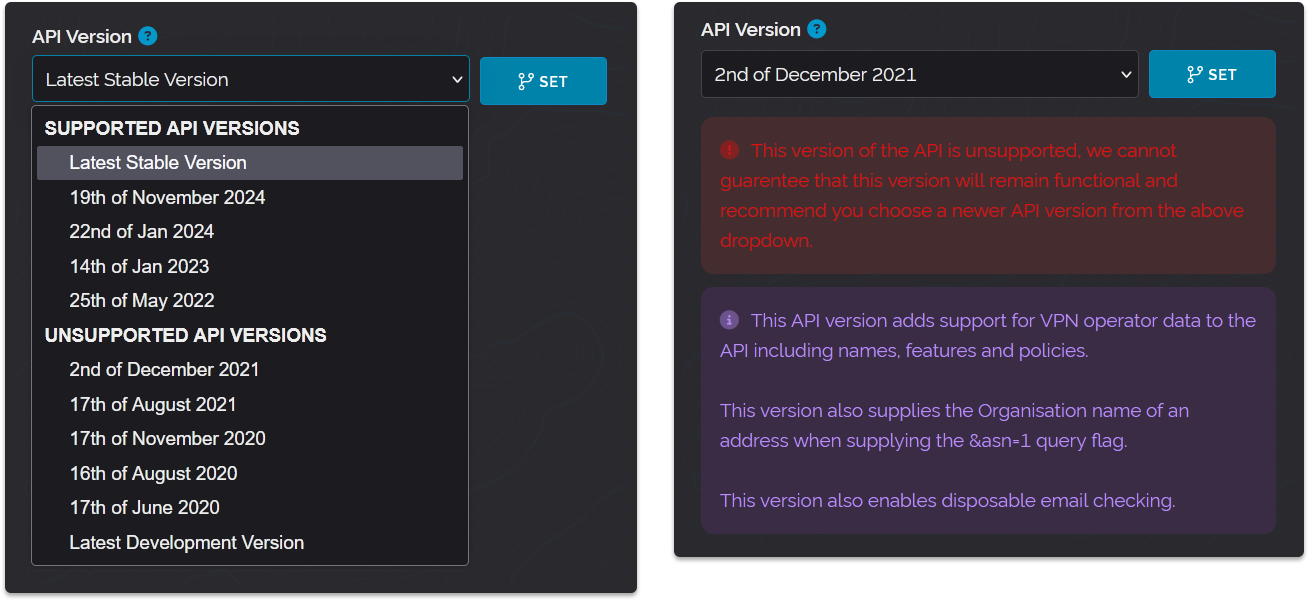
We have methods we devised years ago to support multiple versions of our API's simultaneously and you can still select major versions of the v2 API going back to June 2020 from the customer dashboard. We intend to maintain support for the v2 API for the next 10 years. And in-fact even if you make a request to our long since retired v1 API right now it still works because requests made there are proxied to our v2 API and then the format is adjusted to fit the v1 format.

In the far flung future we will likely do the same for our v2 API so that it will continue to function years after we drop support some time after 2035. So in short, don't feel like you need to rush to upgrade to v3, this is very much going to be a smooth transition on a time table of your own choosing.

The upgraded Dashboard

As mentioned above the Dashboard did have to be upgraded to support the v3 API's data. We have now transitioned all our backend data to new formatting which is more storage efficient, faster to access and with per-minute resolution. This means the bar charts and graphs are more accurate and it's easier for us to maintain because we're not duplicating the data we're recording for different graphs and exportable statistics, it's all now unified. We've also upgraded the v2 API to save its data in this new format that the v3 API uses, in-fact they've been doing so since June this year.

One major part of the Dashboard that is new is the Positive Detection Log, previously each IP would only show a single determination for an IP. So if an IP happened to be hosting, compromised, scraping, VPN and a proxy all at once.. well all you saw was "proxy" and all that other information was not presented to you.

If you're using the v3 API this changes, all of this will now be available to view and this is how it looks in the Dashboard represented by colour coded icons.

Image description

You can hover your cursor over the icons to get a little tooltip explaining what they mean. In the above we have proxy, vpn, compromised, hosting and then a unique icon for IVPN which is a VPN service operating this IP address. All VPN operators will have icons like this which use the first letter of their service and their unique brand colors (clicking them will take you to their website in a new tab).

In addition to these changes we've also made the dashboard much faster to load for subscribed customers. Prior to now when loading the dashboard a server-side connection was made to our payment processor to obtain information like your credit balance and next billing date. This could delay loading the dashboard by several seconds and so we've moved the display of this information to a deferred load.

We've also altered the Dashboard's payments backend, we now support entering your business VAT ID's at checkout, we will remunerate sales tax to your country automatically and we now support setting up plans via Webhook from our payment provider which means if you navigate away from the checkout after purchasing a plan your paid service will still be delivered via webhook.

What happens next?

Now that we've launched the v3 API in open beta we are accepting any and all feedback from you. We will continue the beta for as long as needed to iron out all the issues that get discovered and to also improve the output format. Once it's stable we'll do another blog post to let you know.

And if you're a developer who wants to make a library, plugin or app using the v3 API please do so and let us know, we will feature it in our documentation for users to get going with v3. We currently maintain our own PHP library on GitHub where we will be publishing a development branch to support v3 once it's out of beta.

As always thanks for reading and have a wonderful week!


New Asian Infrastructure

Image description

Before we get into the new infrastructure, we just wanted to recap what has happened to our prior Asian infrastructure and why we're making a change.

Just over two years ago, we introduced two servers into our infrastructure to serve our customers in the Asian and Oceanic regions. We rented servers in Southern Asia, specifically in Mumbai, India, and they served us moderately well during that period. Although both servers experienced storage device failures early on, we persevered with them.

However, starting in May this year, we began to experience significant network degradation with these servers, which was noticed by customers and caused significant delays in API response times, in addition to failed requests. Our network partner CloudFlare, which acts as our Content Delivery Network (CDN) were made aware of the network faults and successfully intervened to fix them.

However, the entire saga lasted more than a month, and in fact, we brought online an emergency server at a different datacenter in Singapore at significant cost in a bid to reduce latency for customers while the network issues with our Indian based servers were ongoing.

Fast forward to early June, and the network issues were resolved; we switched back to our Indian servers and continued to operate like normal. But then, a few days ago, the network problems came back, and so we once again rented a temporary server in Singapore to handle traffic while we waited for a response from our Datacenter and CloudFlare.

Ultimately, we feel that these issues with our servers in India have reached a threshold where we can no longer tolerate their problems, and, looking at our traffic over the past 60 days, we can see that even when they were working properly, there were still spikes of intermittent connectivity and high latency. So we've decided to get rid of them and go all-in on Singapore.

This decision wasn't taken lightly, as Singapore is quite literally 8x more expensive for both hardware and data than India was for us due to various incentives we were provided to utilise servers based in India by our datacenter host. But ultimately, it doesn't matter how good the pricing is if the servers can't be used and are providing a bad experience to customers.

In addition to performance as a reason, we looked at our Asian traffic mix and saw that 85% of all our Asian traffic was, in fact, from Singapore. It's a popular destination to host servers, and obviously, a lot of our customers are there. It's also physically closer to Australia and New Zealand, which were also being served by our Indian servers.

So not only will the network health be better, but the latency will be greatly improved for our Asian and Oceanic customers just due to geography. Now with this move, we are going from two servers to a single server, but our load balancer will failover to our European infrastructure if there were to be an incident, so we're not compromising on uptime or availability.

Since we're going all in on Singapore, we decided to rent a very performant bare metal server and not use a VPS. This way we get uncompromising performance, and it's a like-for-like replacement for the previous Indian servers, which is to say this one server is faster than both Indian servers combined, and it's, of course, powered by AMD, like most of our servers have been over the past few years.

The new server was deployed today, which you can view on our recently revamped status page. Our focus right now with infrastructure is to purchase high-powered servers that can handle lots of traffic and requests instead of lots of low-powered servers that may struggle individually. This also suits our performance requirements, where we're always looking to get the request latency of the API down as low as possible.

So that's the update for today. I also just wanted to reiterate what was alluded to in the last blog post, we do have a significantly big announcement coming in the near future, we're hard at work on the next chapter of the service, so check back next month for your first look at that.

Thanks for reading and have a wonderful weekend.


Dashboard Improvements & Custom Rules API

Image description

Over the past several weeks we've been adjusting the website's appearance and usability. Today, we'd like to share some more changes we've made since our last blog post.

Signed In Devices

A few years ago we added a feature to the bottom of the customer dashboard that allowed you to sign out any devices that were signed into your account. Essentially erasing their sessions server-side so their access to your account can be revoked even if you don't have access to those devices anymore.

We wanted to expand on this feature by actually showing you the devices which are signed into your account, what browser and operating system they're using, the country and region they accessed your account from and the last time they accessed it. To that end, we've added a little blue question mark next to the "Sign out everywhere" button which will show a little pop-up like in the screenshots below illustrating the same view on our dark and light site themes.

Image description

We decided to make this feature ourselves in-house instead of relying on an external service or product. This means we will maintain the list of device characteristics ourselves. To begin with, we're supporting all the major browsers (Firefox, Chrome, Edge, Safari, Opera, Brave, Internet Explorer) and also the major operating systems (macOS, Windows, Linux, Android, iOS, iPadOS, ChromeOS etc). But we've also added some specific detection for particular devices so for example if you're using an iPhone it will just say iPhone instead of iOS. We've also done this for iPad and some other product categories.

This device data is stored server-side with your normal account information and when you clear your signed-in sessions (either one at a time or everything all at once) the data associated with the erased session (browser, os, location, last seen time) will also be erased from our servers at the same time. We're doing it this way because this feature isn't intended for us to track you but for you to track access to your own account.

Confirmation Dialogs

We've had confirmation dialogues for a few important areas of the Dashboard including changing your API key, upgrading or downgrading your paid plan, cancelling a paid plan and erasing your account. We did this to make sure unintended changes weren't made by accident. But customers have told us they would like these confirmation dialogues in more areas specifically when they try to erase a Custom Rule or Custom List.

We completely agree and so we've added confirmations to both of those features, when you try to erase a rule or list a modal will appear with a darkened background which asks you to confirm or cancel the removal like in the screenshot below.

Image description

Custom Rules API

A feature we've been asked for a few times since we introduced Custom Rules has been a way to interact with your Custom Rules via a Dashboard API like you can with Custom Lists and CORS domains. The reason we've not added this feature is because Custom Rules are very complicated and we feel the user interface within the Dashboard is the best way to create and alter Custom Rules.

However, there are things we can make accessible that do make sense to enable through an API. Viewing which rules you have in your account and whether they're enabled or not, exporting rules the same way you can through the Dashboard interface (for manual editing or later re-import) and toggling rules on or off.

To support these use cases we've added a new Dashboard API endpoint which you can view all the documentation for here. We've also taken the time to update our official PHP library to support this new Custom Rule Dashboard API. You can obtain that from packagist here or by using the relevant composer command within your environment.

So that is all the updates for today, we do have some much bigger things being worked on alongside these more minor interface changes but it will likely be a few months before we're ready to share those with you. Until then we hope you liked todays changes and have a wonderful rest of your week.


Website Design Updates

Image description

Over the past week, you may have noticed the site receiving some design updates. The most significant of these is the new top navigation bar, where we've made many usability improvements.

The New Navigation Bar

Firstly, we wanted to keep the colors the same. We consider the red-to-blue gradient part of our brand, and so while we did experiment with some monochromatic navigational bars with blurred transparency, we decided to stick with the strong colors we've always had. Of course, it still supports both our light and dark site themes.

Secondly, we needed to declutter the navigation bar which meant moving some of the lesser accessed links to dropdowns. We didn't want to just have basic list dropdowns though so we created cards with miniature screenshots of the pages with matching header colors and descriptions. We still kept the most important links always accessible though including the Dashboard which is accessed most frequently by customers.

Thirdly, improving the mobile experience. The "hamburger" menu as it's commonly referred to was difficult to use on mobile devices due to how we had implemented it. With this total rewrite of the navigation bar, we were able to significantly improve the menus reliability on mobile and make it look much nicer too. We also had enough room to keep a dedicated Dashboard button present while on mobile.

Fourth, legibility. The previous navigation bar used thin text that was difficult to read against our bright background gradient. We have now switched to a more bolder font style and we've introduced our staggered dropshadow present on other page elements to the text of the navigation bar aswell. This makes it much easier to read and we've also done away with reducing the size of the font if your display size is smaller than average, we instead reduce the whitespace between menubar items before finally stepping down to the mobile interface. This keeps the navigation bar text legible on all screen sizes at all times.

Fifth and finally, site-wide address lookups. This has been something we've wanted to add to the navigation bar for a while, the ability to lookup an address from any page on the site. We've renamed our threat pages to lookup pages as this much better represents what these pages are for.

Design is an iterative process and we will likely perform a few more tweaks to the navigation bar over the coming months.

Status Page Updates

Over the past several weeks we have been dealing with network issues with servers in our Asian service region and due to that, we had to take the entire region offline and forward traffic to our European servers. This resulted in our customers based in Asia facing higher than acceptable latency and although our status page indicated our Asian servers were offline for maintenance there wasn't any reason provided for why that was the case.

To remedy that we updated our status page with a new incident messaging feature that lists current incidents at the very top of the page and past incidents at the very bottom providing both current and historical information. We spent some time on the presentation, colors and iconography of this feature to make it as accessible and understandable as possible. Our key goal was to provide you with the exact information you need in as concise a way as possible.

So those are the updates for today we're constantly re-evaluating the service and that includes design, making sure we're staying current with modern expectations and maintaining a high level of usability and efficiency in our designs, we think we've struck the right balance with these updates and hope you think so too.

Thanks for reading and have a wonderful week!


API Performance Improvements

Image description

Today we've pushed live an update to the API that improves performance and we wanted to talk about it. Over the past two months we've been evaluating every aspect of the service to locate performance bottlenecks and correct them. You may have seen this blog post we made on April 10th about this where we changed a lot of things related to storing customer data and the customer dashboard.

That work has been ongoing, and we've been squashing bugs and handling edge cases that resulted from those changes. We've also been rewriting significant parts of our data synchronisation system, and as a result, we've been able to significantly lower CPU usage on all our servers. Essentially, our servers now spend less CPU time on database stuff so they can put more resources into answering your API queries.

However, there was one area we had not changed in a while. In this blog post from November 2022 we mentioned how we were preparing to deploy PHP v8.2. We did deploy PHP v8.2 on both the API and our website the following month. However, we've stuck with PHP v8.2.x versions since then. Meanwhile PHP v8.3 and now v8.4 have been released and we were lagging behind. To be clear we still used a supported version of PHP that has been receiving security patches and bug fixes, but we weren't using the latest major versions that contain improvements to the language, new features and crucially for us, extra performance.

Today however that all changes as we've upgraded all the way to PHP v8.4.7 the very current release and in doing so we've improved API response times. Previously for our servers that achieved an average of 5.7ms internal processing time (network overhead not included), we've been able to lower that to an average of 4ms. While this isn't a lot in time terms as a percentage that's a 29.8% reduction in average compute time.

In addition to upgrading to PHP v8.4.7 across the entire site (our Dashboard and other pages will also benefit from these speedups and in fact, should benefit even more than the API due to their larger footprints) we've also been optimising the API itself. We've eliminated two disk read operations which checked for the existence of data that no customers made use of, these reads had nanosecond level impacts but extrapolated across all the queries we handle it adds up.

Similarly to the above optimisation, where we couldn't eliminate a disk read we instead moved the data to our in-memory data store system. Accessing data from memory is much faster than from storage disks (even though we exclusively use NVMe SSDs) and it allows for higher throughput of the API by not needing to wait on storage queues. In fact, our in-memory data store is fully multithreaded and non-blocking too. We were able to offload three separate database reads from disk to memory with this change and at least two of these are used by every single query to the API.

We've done extensive testing to make sure these changes especially the move to PHP v8.4.7 are fully tested. We performed millions of varied queries against the API and tested all our web pages and most of the functions within those pages before pushing it live. As always though it's possible we missed something so if you notice anything not working correctly please contact us, we do respond to every communication we receive.

So that's the update for today, lots of performance improvements and a major server-side code interpreter update, thanks for reading and have a wonderful week!


New North American Nodes

Image description

Today, we have introduced two new high-end servers into our North American service cluster called Vega and Nova. These servers are based on AMD's EPYC Genoa platform like our previously introduced Rigel system a few months ago.

By adding these new servers, we're increasing our North American capacity by 50%. And similarly to our previous rationale for adding higher end servers we wanted more buffer against burst usage by customers who are under momentary attacks.

These new servers share the same host as our Rigel server we introduced in February but they don't use the same host as our three other North American nodes (Lunar, Saturn and Jupiter) which helps to insulate us against any single host having unforseen network or power issues.

So that's the update for today, thanks for reading and have a wonderful weekend.


Backend changes and some growing pains

Image description

Today we wanted to talk about some changes we've been making behind the scenes to help us scale to meet the needs of our growing customer base. You may have noticed over the past week that the customer dashboard has not been working as reliably as it should with changes made within your account not synchronising amongst all our infrastructure in a timely manner.

We've also had issues with new users signing up only for their accounts to not be activated by our internal systems, resulting in them being unable to log in and use their accounts. Both of these issues are linked to the same problem, which has been the unreliable synchronisation of data amongst our nodes for our most high-traffic database operations.

This includes things like signing up, changing any setting in your account and the creation or modification of user-generated content (custom lists, custom rules, CORS domain entries etc). We put these things in a fast-track lane so that the Dashboard always feels snappy even when your dashboard requests could change from one server to another in our cluster during a single user session.

But as we've grown we are seeing more and more traffic targeting the dashboard and this once super-fast lane began to slow to a crawl culminating in this week where changes and additions to customer data were greater than the ability for our servers to synchronise those changes in real-time.

To solve this problem we looked at the way we've been handling requests to and from the database and identified many pain points. The biggest one was the amount of database transactions for a single dashboard web request this includes both loading the dashboard and also creating or modifying content within it and then sharing those changes with other server nodes.

By restructuring our customer data and coalescing the gathering and saving of that data into single database operations we've been able to reduce traffic between nodes by a factor of 7 on average for a user accessing their Dashboard and by a factor of 3 to 5 when they make changes depending on what those changes are.

As a result of these changes, the dashboard and user signups are now being handled in real-time again. In addition to these changes for our most accessed customer data, we've also been working on the slower database synchronisation we use for big data. This includes things like customer positive detection logs.

One thing we noticed here is a lot of this data is rarely accessed but the enormity of it was significantly delaying our ability to bring up new nodes (due to the need to synchronise all this data) and the ledger size of our database that maintains a listing of what is synchronised and which nodes are missing data was getting very large and becoming a burden for our server nodes to handle.

To solve this problem we've begun to compress all high-impact user data and as a result we've been able to reclaim 80% of the disk space utilised by this data. This has also had the side-effect of making this data much faster to access as even though we use high-end Solid State Drives on all our servers, storage is still the slowest component out of the CPU, RAM and Storage in a server. So by decreasing the size of the data we're loading from our disks, we can load it into memory much faster.

In addition to the compression, we've also altered how our database blocks work. Prior to this week, all data in the database were stored in 8MiB blocks. This made things mathematically simple. But as user data has grown the amount of blocks has increased to an unmanageable amount. Due to this, we've now moved to an adaptable block size between 8MiB and 64MiB with customer data being placed into appropriately sized blocks depending on their data volume. Since servers need an entire block before they can access the data inside we will adapt what size block is used for a specific customer's data based on their data volume with smaller blocks able to transition into larger ones as their data grows.

So this is the update for today, we're hoping that there won't be too many teething problems but to be honest with you the database scheme updates that apply to the Dashboard are rather major and were introduced faster than we would have liked due to the serious performance degradation we were seeing. What this means is, there may be bugs and we ask for your patience and diligence in reporting any you find.

Thanks for reading and have a great week!


New European Node!

Image description

Today, we have introduced a new high-end server into our European service cluster called Titan. It is named after Saturn's largest moon, which boasts a thick atmosphere and a landscape of liquid hydrocarbon lakes, making it quite unique in our solar system. This server is based on AMD's EPYC Milan-X platform and is currently the most powerful server in our cluster.

By adding this new server, we're increasing our European capacity by 20%. The main reason we've done this is that we wanted more buffer to withstand momentary increases in API usage, which sometimes happens when our customers come under targeted attacks.

This new server also further increases our provider diversity as it's not hosted by the same datacenter partners we've been using for any of our prior nodes and it's deployed in a different country to our other nodes as well (we are now using three different countries for our European nodes).

As we mentioned in the introduction of our Rigel node two months ago, we will also be refreshing a server later this month, that server will be our North American node called Lunar. We intend to keep the node name the same but it will be transitioning to a different provider and more capable hardware based on AMD's EPYC Genoa platform which Rigel already uses and we've been very happy with.

So that's the update for today, thanks for reading and have a wonderful weekend.


Disposable Mail Detection Improvements

Image description

Today, we would like to share a big improvement we have made to our API's disposable mail-checking feature. We launched this feature a few years ago and it lets you check whether an email address belongs to a disposable or temporary mail service so that you can deny service to uncontactable users.

The biggest roadblock we've encountered since launching this feature has been the collection of disposable domain names from the hundreds of sites that offer temporary mail services. The reason for that is their increasing use of anti-bot technology, which made it hard for us to collect their domains in an automated fashion. Often requiring us to collect them by hand which meant there were large periods where certain temporary mail services were underrepresented in our data.

That however has changed over the past several days since we deployed a new gathering system which utilises AI agents to browse these sites, solve captchas and other anti-bot screens to collect the domains. More than half of the sites we profile (and there are a few hundred) employ some kind of anti-bot screening or captcha system.

But with our new AI agent-driven gatherer we've been able to add hundreds to thousands of new domains to our database every day since deployment thus making our disposable mail system much more effective.

So that's the update for today, we hope you'll try the disposable mail detection and feel free to let us know what you think or if you've found a disposable mail site that is giving you results we don't have, send us a message and let us know, we'll build a profile for them.


Back